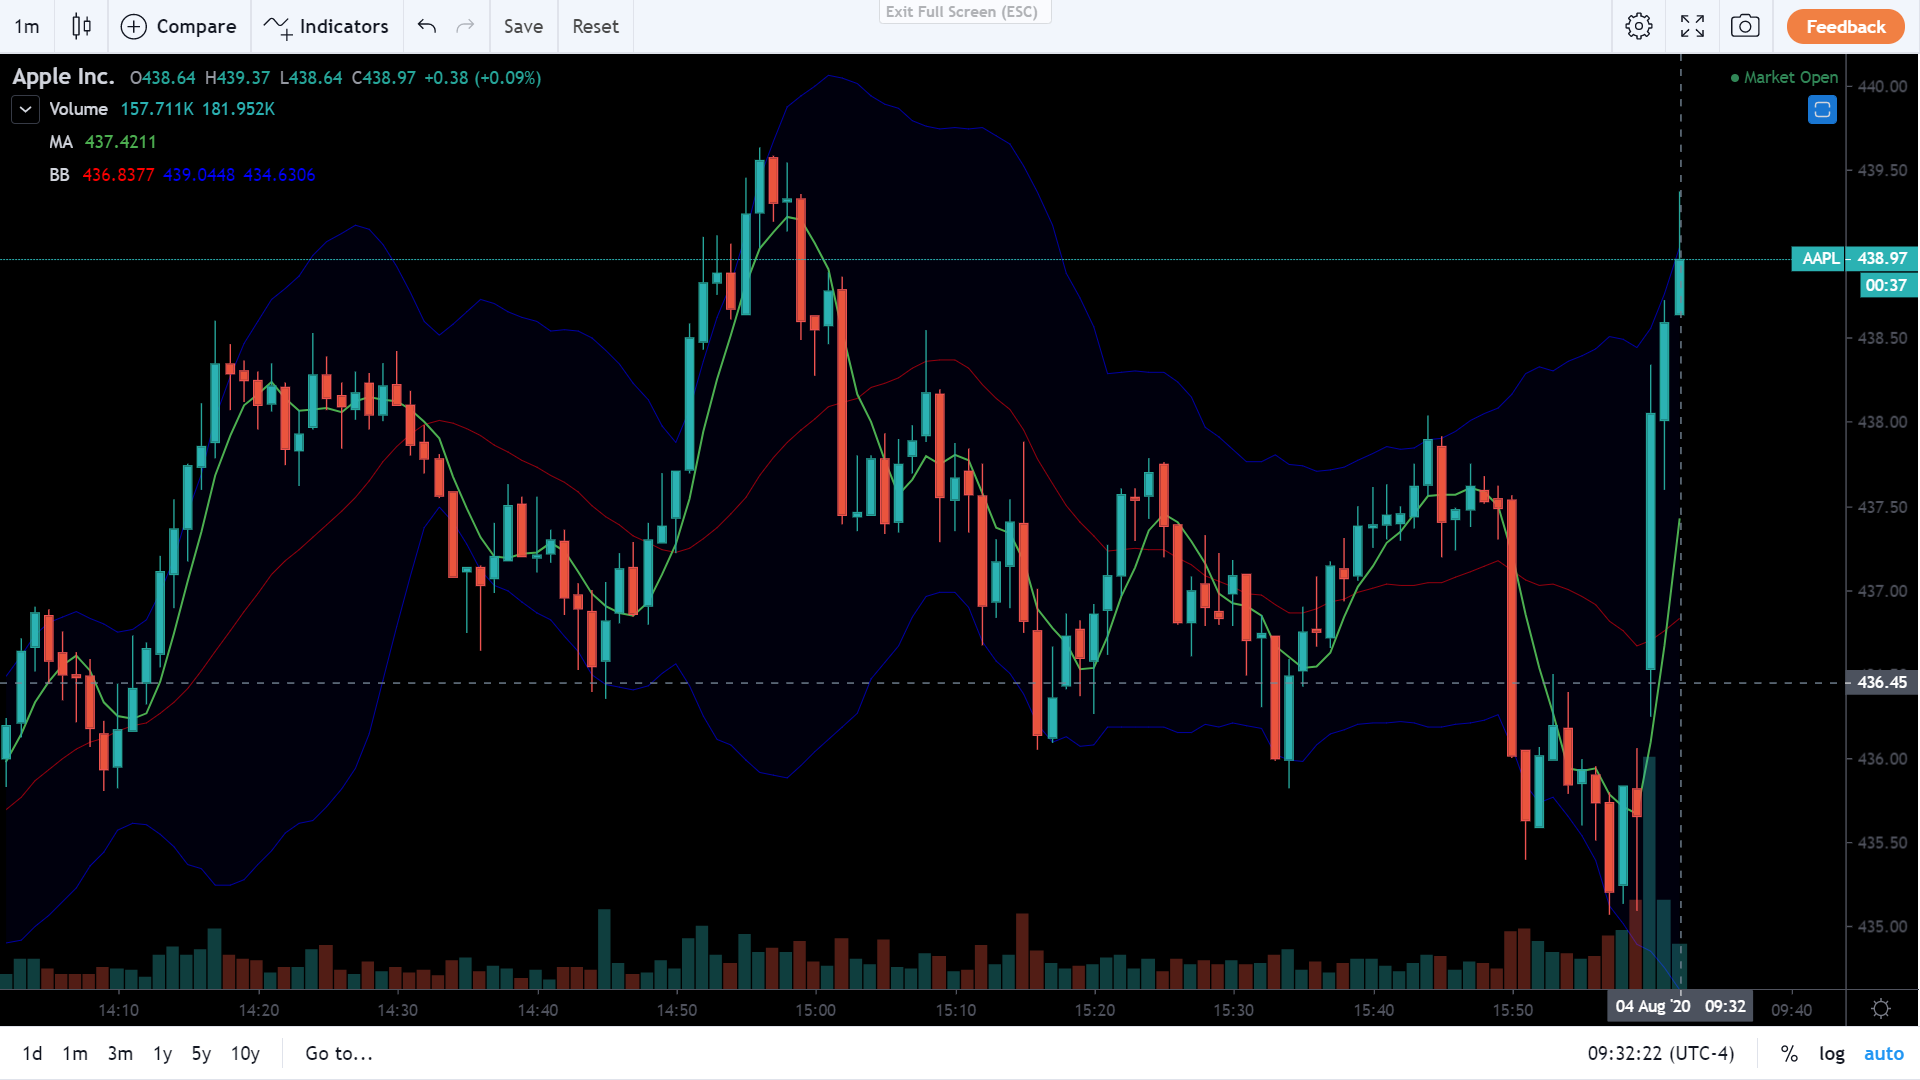
Major Chart Upgrades are Here: Streaming Data, Advanced Drawing Tools and more…
Are you an investor who regularly checks real-time stock trends and favors technical tools to make investment decisions?
Today, we’re introducing a new real-time investment & stock market streaming chart with various advanced tools.
Supported by the financial chart development company Tradingview, the new charts display real-time data that you can interact with and customize, and come with more indicators and drawing tools that will allow you to place trades more strategically.
Key new features:
View data in real-time
All individual stock data are displayed and updated in real time and streaming, without any delays. You don’t need to refresh the page to get the latest data.
Customizable, advanced chart settings
You may customize your chart to your specific preference, whether it’s to monitor the price movement of a stock using lines, bars or candlesticks, or simply just to change its background color.
50+ Drawing tools
You can now mark-up your charts using over 50+ drawing tools. Visualizing the chart helps you better track the market direction of a specific stock and seize the timing of entry and exit of your trades.
Download or social share your chart
You may download and save your customized charts so that you can verify them against real stock movement at a later time. You can also share them on social media and hold discussions with other investors.
More than 80 indicators to choose from
You may now choose from more than 80 chart indicators, including commonly used ones like MA, MACD, KD, RSI, etc. The indicators are easy to find with the built-in search feature. In addition, the new charts scale down automatically as you add more indicators, accommodating all your selections in one view. It’s beneficial to users who like to cross-analyze stock trends using several indicators at a time.
Place orders seamlessly
When a trading opportunity arises while viewing a chart, simply hover over the trading box right below the chart and enter a stock symbol to place an order instantly.
Compare symbols
You can now use “Compare” to add stock symbols to your chart. By comparing the stock movements of different symbols, you will have a better idea to determine which stock to trade.
We hope the new chart will greatly improve your trading experience. You can log in to your Firstrade online trading platform account now and use it right away.


