On Thursday, November 5, technology stocks had their worst single day in more than six years. The more useful question for an individual investor is not why it happened but how much of their own money sits in the same place. Many people who describe themselves as diversified hold more technology than they would guess, because it arrives inside funds they never thought of as tech funds. This article shows how to measure that number in four steps, using statements and fund documents you already have.
What Happened on November 5
According to Reuters, the technology sector of the S&P 500 fell 7.3% on Thursday and the Philadelphia Semiconductor index fell more than 12%. Both were their biggest one-day drops in more than six years. Every S&P 500 sector closed lower, but the selling was sharpest in technology and chips. The Nasdaq Composite closed nearly 12% below its October 6 record, past the 10% mark that is commonly called a correction, and the Cboe Volatility Index reached a seven-month high.
Context matters too. The S&P 500 was still up more than 7% for 2026 after the drop, and the next scheduled data point is the October inflation report, due Tuesday, November 10. Chart 1 sets the main figures side by side.
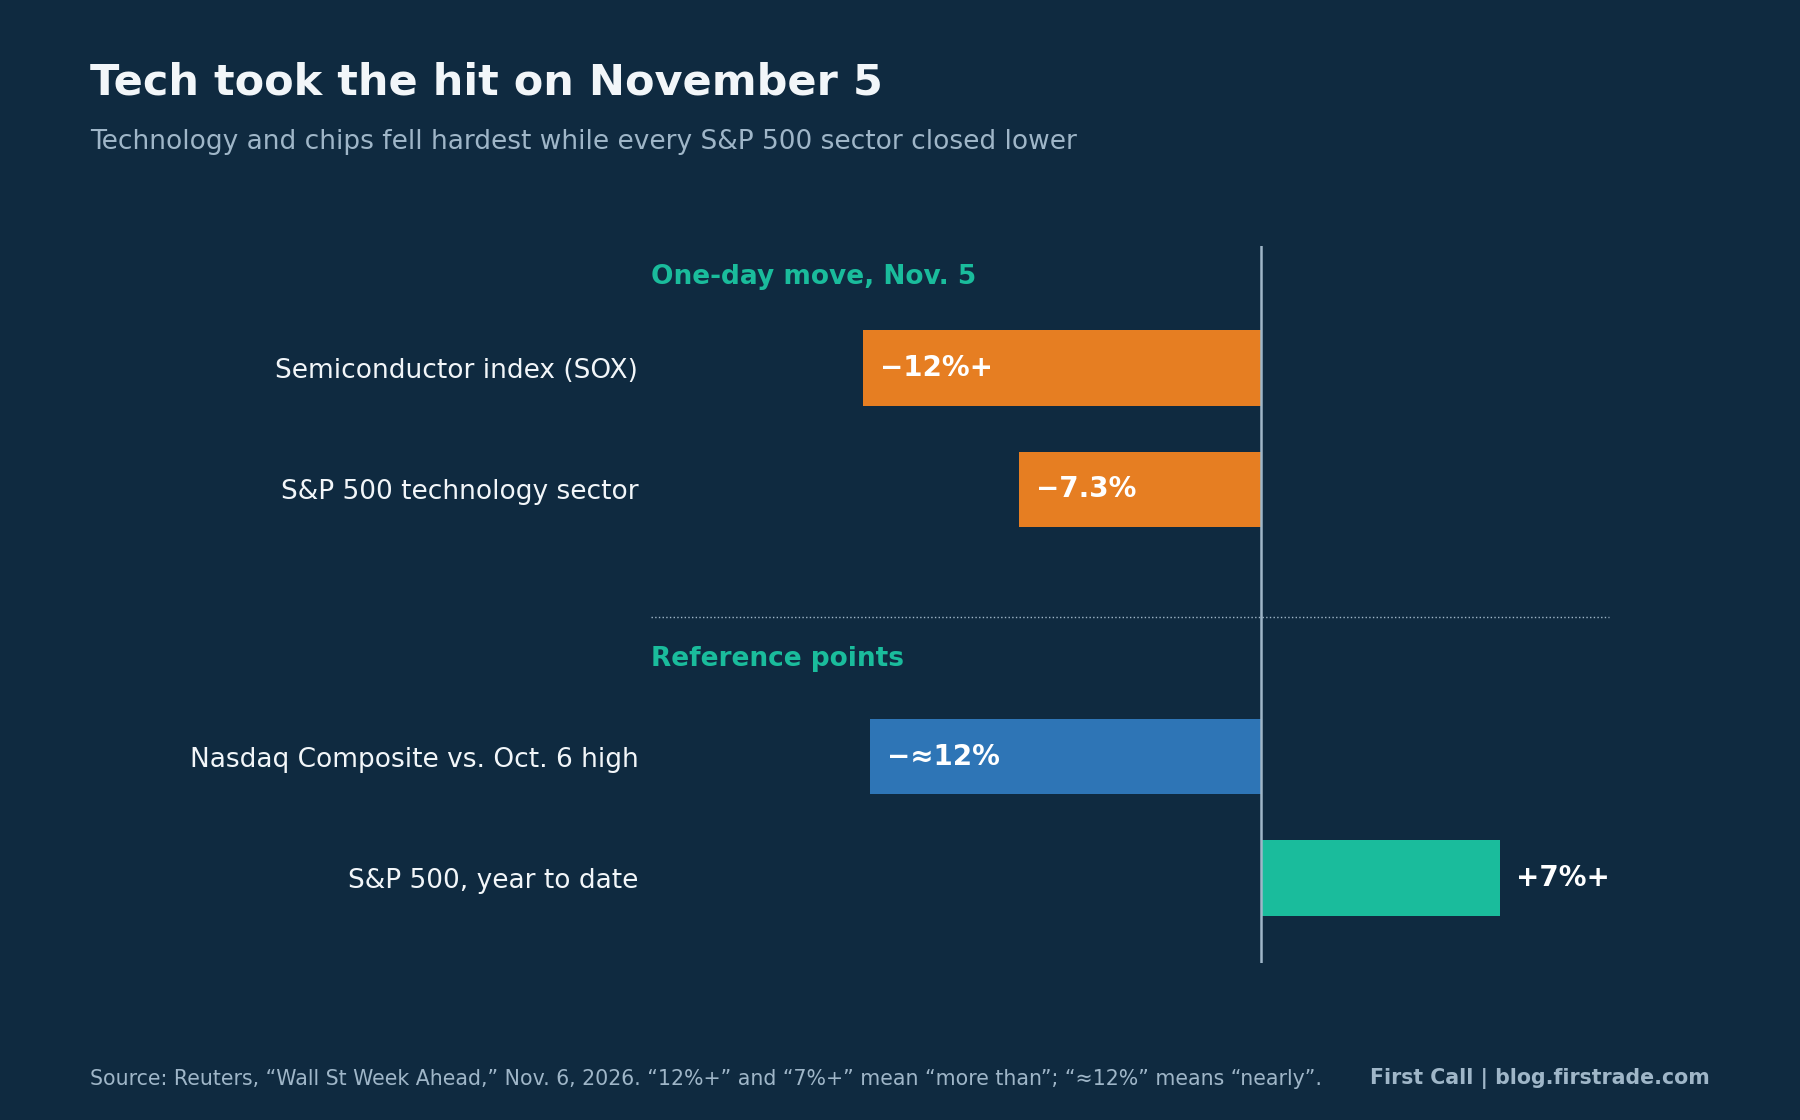
Chart 1: Selected moves reported for November 5, 2026. Source: Reuters, “Wall St Week Ahead,” November 6, 2026. Past performance is not indicative of future results.
What It Means for a Portfolio
A sector move reaches your portfolio in proportion to your weight in that sector. The arithmetic is a single multiplication: technology weight times the sector’s move. If technology is 10% of a portfolio, a 7.3% sector drop accounts for about 0.73 percentage points of the portfolio’s one-day change. At 30% it is about 2.19 points, and at 40% about 2.92. Chart 2 lays out the grid. It ignores every other sector, so it illustrates exposure; it does not predict what any portfolio did.
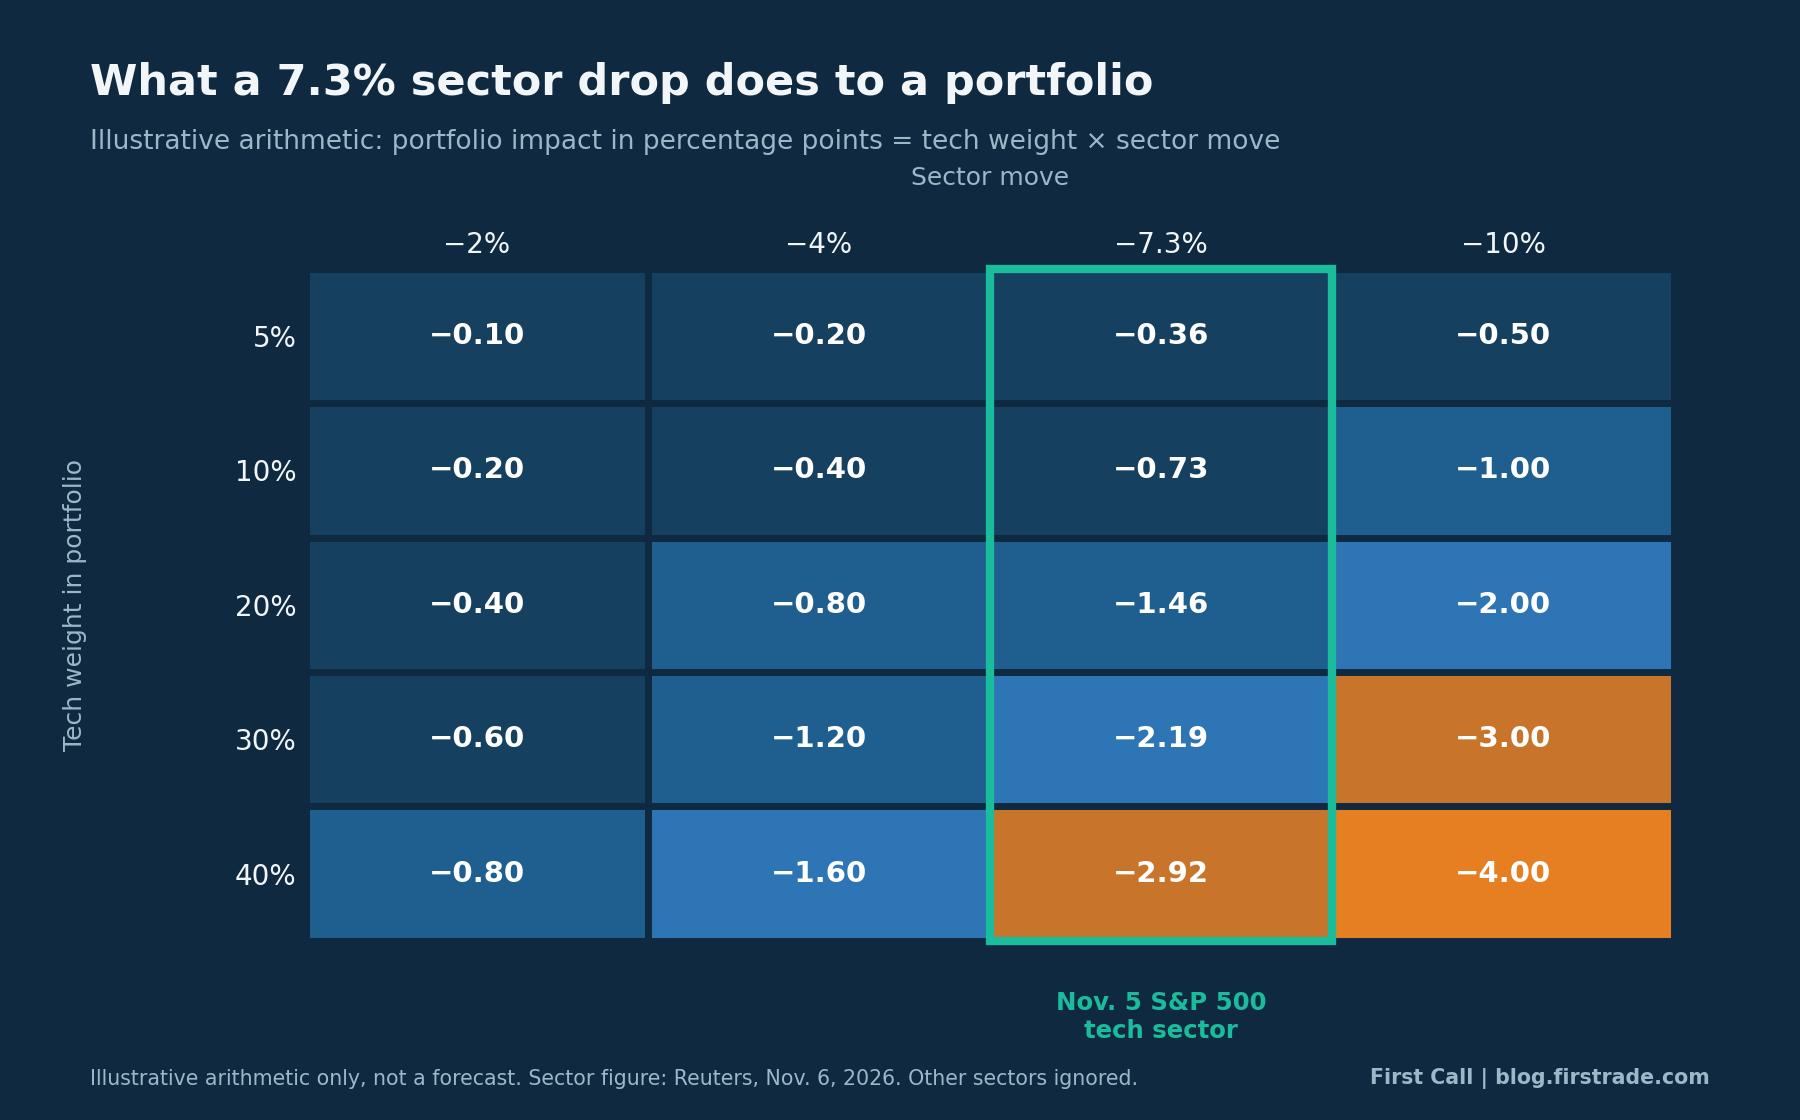
Chart 2: Portfolio impact in percentage points for combinations of technology weight and sector move. Illustrative arithmetic only.
The harder part is knowing your own weight. Technology rarely sits under one ticker. A broad stock index fund holds it alongside every other sector, a growth fund may hold more of it, and individual stocks add their own share. The figure is published in each fund’s fact sheet and prospectus, though providers classify some companies differently, so two funds’ “technology” percentages are not always comparable. If it is unclear which figure applies to a holding, that is a fair question to put to a broker rather than guess at — Firstrade offers 24/7 customer service.
What to Do About It: Four Steps
This is a measurement exercise, not a decision. Nothing below asks you to buy or sell anything; it tells you how large the exposure is, so that whatever you do next is a choice rather than a surprise.
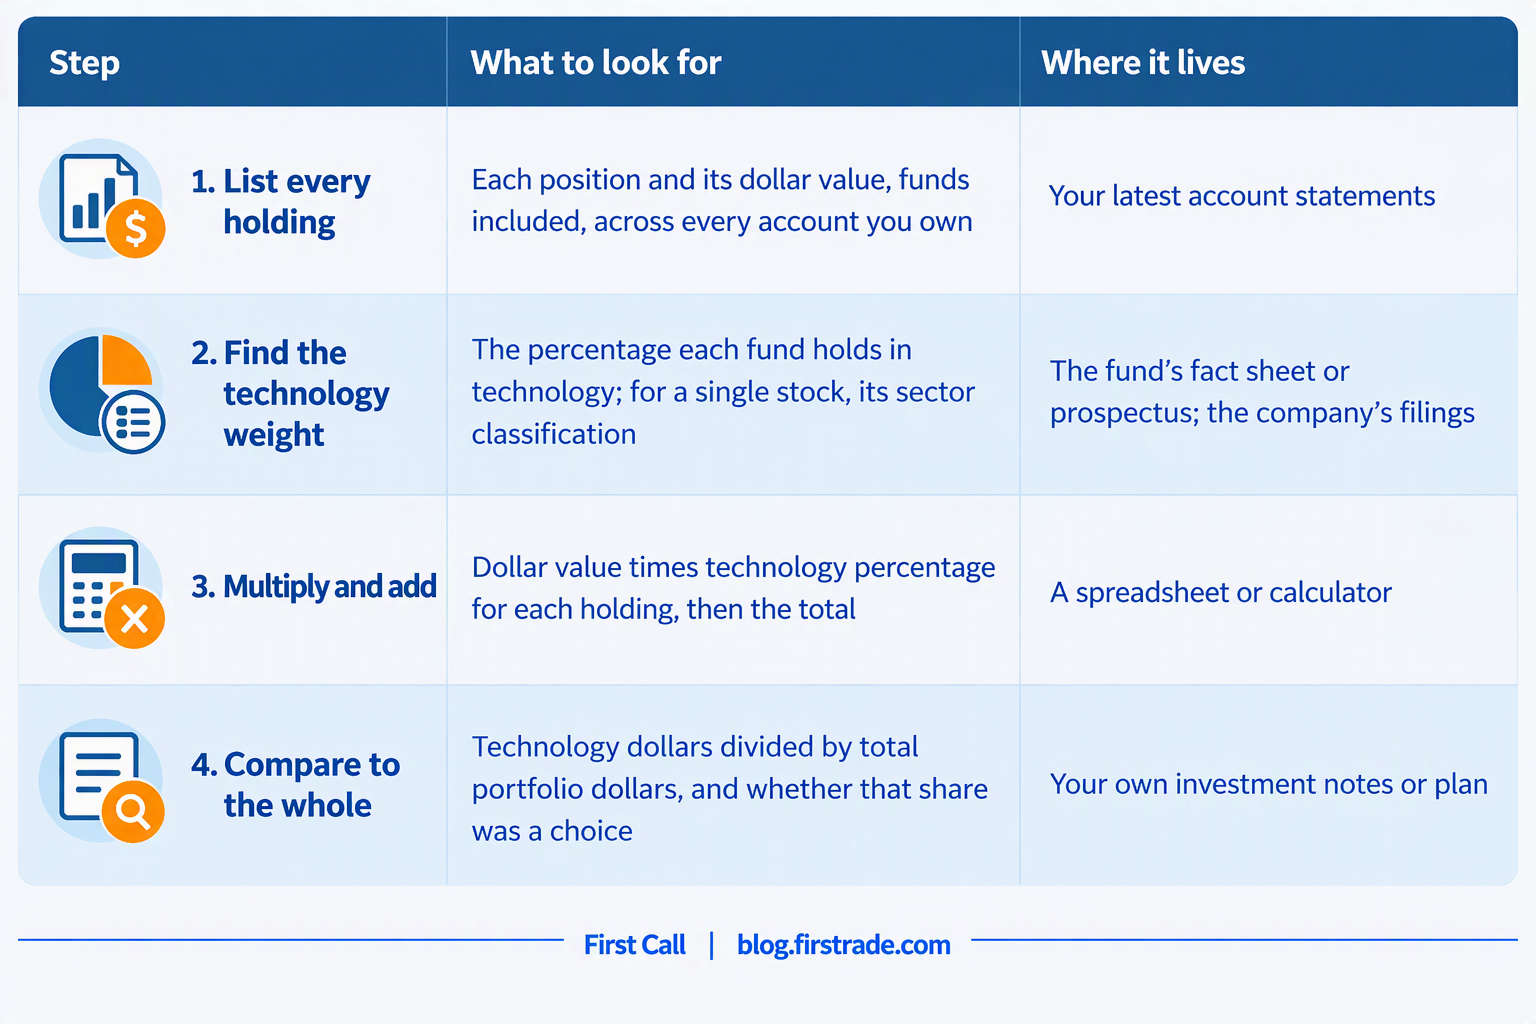
Step two is the slow one, because fund documents arrive as separate files. For individual stocks, a sector-level view shortens it: Firstrade’s Sectors & Industries research tool charts performance data by drilling down from sectors to individual companies all in one page.
Once the total is in hand, the result tends to fall into one of three situations. The technology share is about what you intended, it is larger than you intended because of overlap between funds, or it is smaller than you assumed. Each one is an answer. Overlap is the most common surprise, since two funds that look different can hold many of the same large companies.
Weights also drift. After a sharp drop, technology is a smaller share of the portfolio than it was the day before, and after a long rise it is a larger one, so the number you calculate today will not match the one you would have calculated last spring.
Frequently Asked Questions
Does a 7.3% sector drop mean my portfolio fell 7.3%?
No. Only the part of your portfolio invested in that sector moved by that amount, so a 10% weight contributes about 0.73 points. The other sectors also moved on the day, which is why the grid should be read as exposure rather than as a result.
Why do index funds hold so much technology?
Most broad U.S. stock indexes weight companies by market value, so a sector made up of very large companies takes up a larger share. The exact percentage changes every day and is listed in each fund’s own documents.
Is one day’s move a trend?
A single session says how large the exposure is, not where prices go next. The four steps give the same answer whether markets rise or fall tomorrow, which is why they are worth doing on a quiet day as well.
How current are the sector weights in a fund’s documents?
Fact sheets are dated, typically as of a month-end or quarter-end, so the percentage you read can be several weeks old. Treat it as a reasonable estimate and update it when the next report arrives.
Putting It Together
Adding up your technology weight is an evening’s work with statements you already have. If the answer points to an account you do not have yet, a Firstrade account can be opened online, with $0 commission on online U.S. stock, ETF, mutual fund and options trades and no options contract fees. 24/7 customer service is available if a question comes up along the way.