
Sector rotation has produced a 2026 that looks calm from a distance and lopsided up close. The S&P 500 is up roughly 12.7% year to date. Underneath that number, energy has gained close to 20% while consumer discretionary has lost 5%, a spread of nearly 25 percentage points inside a single index. Whether that gap helped or hurt a given portfolio depends on something most investors have never looked up: their actual sector weights.
What the Index Return Hides
An index return is a weighted average, and averages compress information. A single number cannot tell you whether every component rose modestly or whether large gains in one corner offset losses in another. In 2026 it has clearly been the second case.
Based on sector data reported by Investing.com, energy leads at roughly +19.7% and materials follow at +15.2%, both ahead of the index. On the other side, information technology is down about 4.5%, communication services about 3.1%, consumer discretionary about 5.0%, and health care about 3.0%. Two investors could both hold something labeled 'U.S. large cap' and experience completely different years.
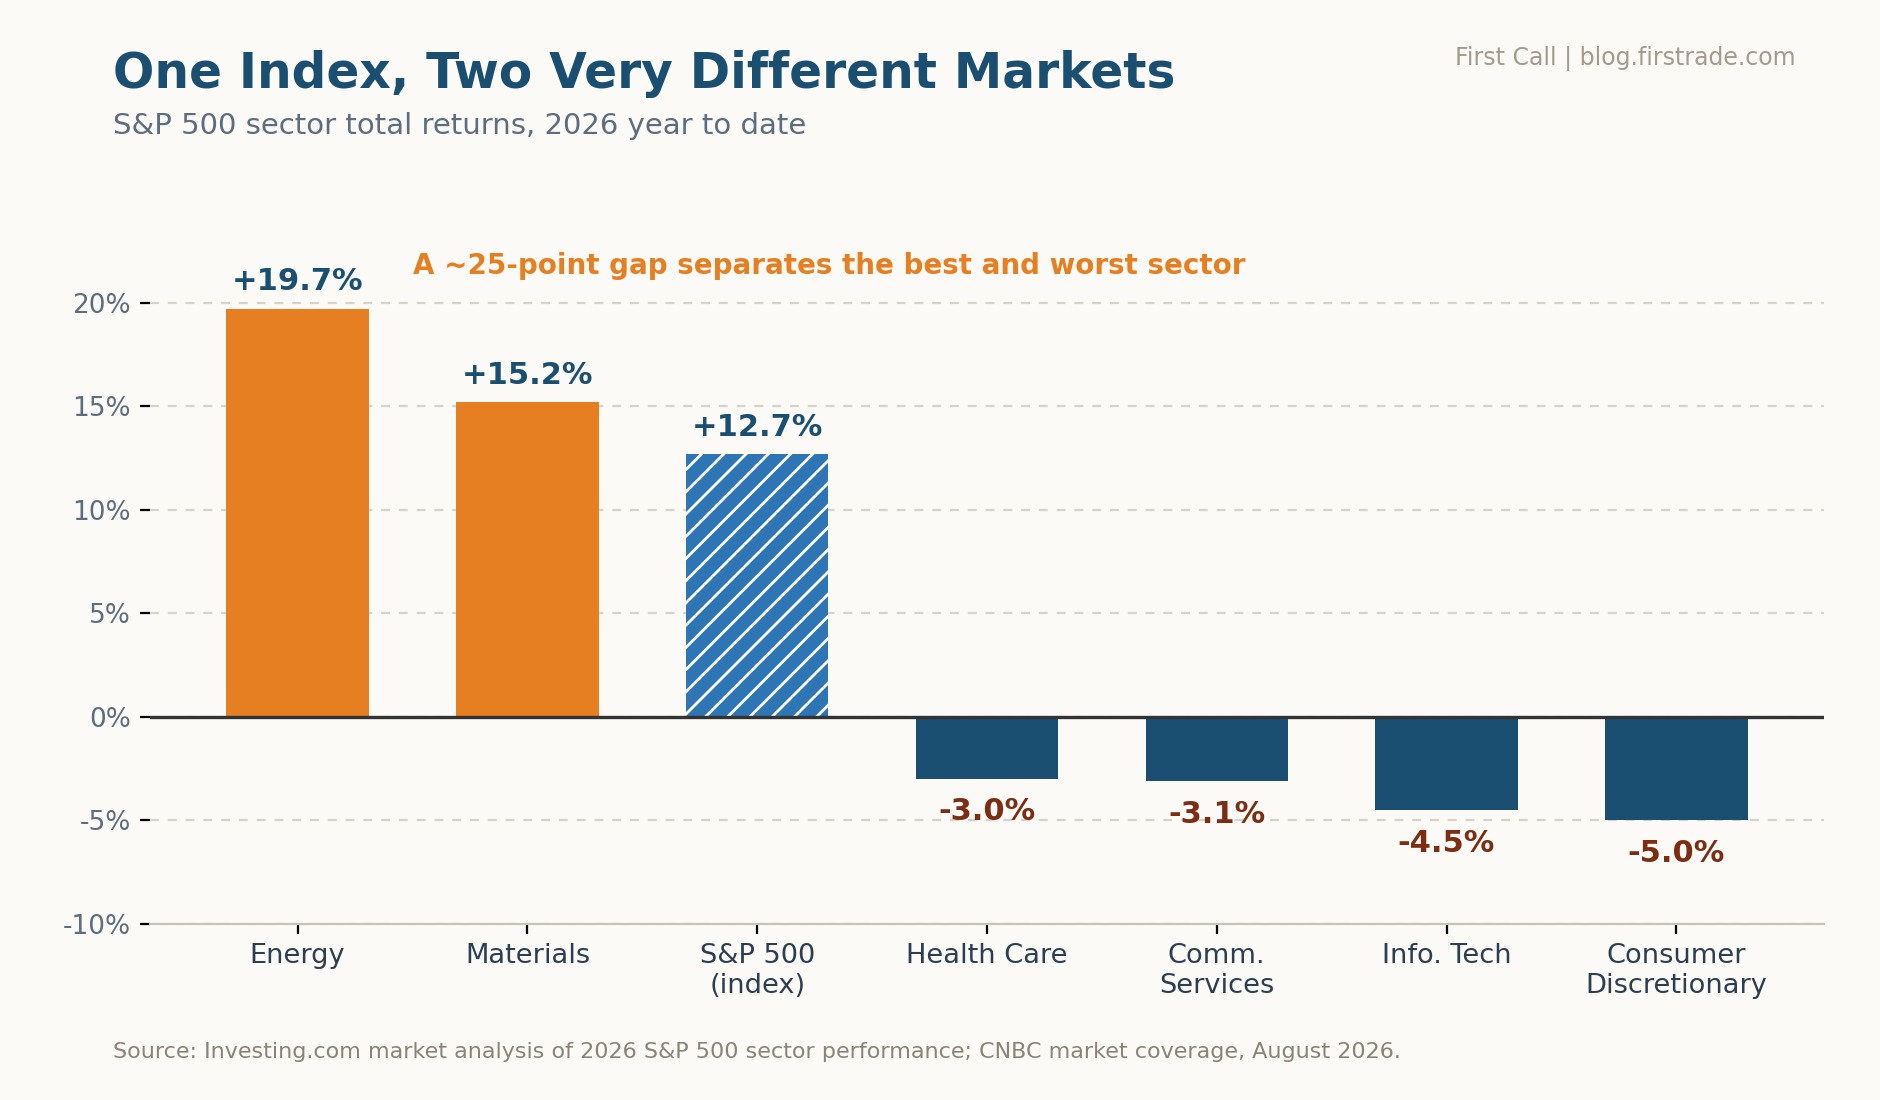
Chart 1: S&P 500 sector returns for 2026 year to date, showing the gap between leading and lagging sectors. Past performance is not an indicator of future results and there is no guarantee this trend will continue. Investors cannot invest directly in an index.
Sector rotation describes capital moving between parts of the market as the rate environment and relative valuations change. Coverage from Investing.com and CNBC points to several overlapping drivers this year: higher rates weighing on companies whose value depends on distant earnings, questions about how quickly large AI capital spending converts to profit, and low starting valuations in previously overlooked sectors.
Why Relative Performance Is the Number That Matters
For anyone comparing a portfolio to a benchmark, the informative figure is not a sector's raw return but its gap versus the index. A sector that is flat in a year the index gains 12.7% has cost 12.7 points of relative performance, even though nothing appears to have gone wrong.
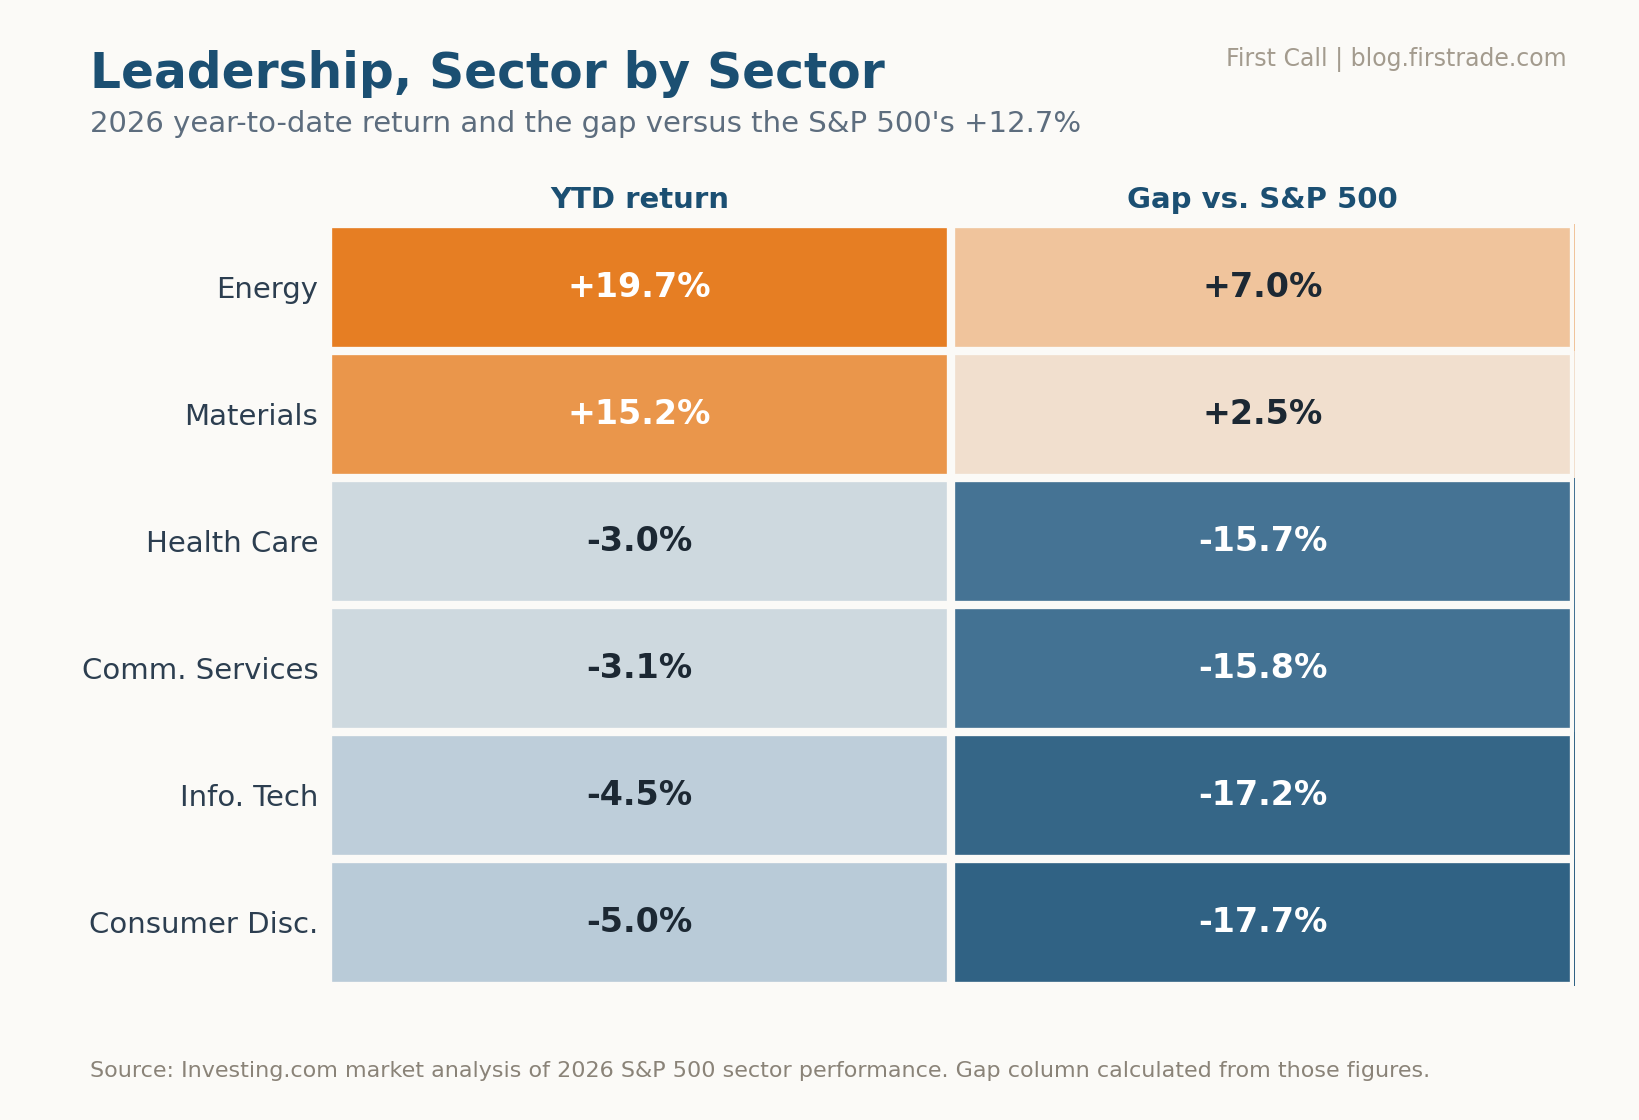
Chart 2: 2026 year-to-date sector returns alongside the gap versus the S&P 500's +12.7%.
Chart 2 shows energy roughly 7 points ahead of the index and consumer discretionary trailing by nearly 18. That relative view explains why some diversified portfolios felt disappointing this year even as the headline number looked healthy. The complication is that a broad index fund is not equally exposed to every sector: market-cap weighting means the largest companies carry the largest weights, and technology-related names have recently made up an unusually large share of the S&P 500. An investor who believes they hold eleven sectors may in practice be tilted toward a handful. Every fund publishes its sector breakdown in its prospectus and fact sheet, which is where this stops being theoretical. Seeing how the sectors themselves have behaved is a separate step: Firstrade's Sectors & Industries research tool charts performance data from the sector level down to individual companies on one page.
How to Check Your Real Sector Exposure
This is a one-sitting review. It answers a question a headline return cannot: which parts of the market is my money actually in?
Acting on what step three turns up usually means a few modest trades rather than an overhaul, and small trades are exactly where costs bite hardest. Firstrade charges $0 commission on online U.S. stock, ETF, mutual fund and options trades, with no options contract fees, which is what keeps a two-point adjustment from costing more than the drift it corrects.
Frequently Asked Questions About Sector Rotation
Can sector rotation be predicted?
Rotation is far easier to identify after the fact than in advance. It is generally described as a pattern observed in market data rather than a reliably forecastable sequence, which is why most long-term frameworks treat it as a reason to stay diversified rather than a signal to reposition.
Should a lagging sector be avoided?
A low return over one partial year says little about a sector's long-run role. Today's laggards have often been previous leaders and the reverse, which is the observation that supports holding a mix rather than chasing one.
How many sectors are in the S&P 500?
Eleven. This article discusses six of them plus the index itself, chosen because they sit at the extremes of 2026 performance.
Does rotation mean the market is weakening?
Not necessarily. In 2026 the index rose while leadership changed hands, which describes a market whose composition is shifting rather than one broadly declining.
The Takeaway
The useful response to dispersion is not guessing the next leader. It is knowing what a portfolio holds, understanding how much of its outcome depends on a single theme, and having a rebalancing rule written down before the market makes the decision feel urgent. Years with wide sector gaps reveal whether a portfolio was built on a plan or on momentum, which is more valuable information than any single sector's return.
Pulling your blended sector weights and setting a rebalancing date takes one sitting. A Firstrade account can be opened online, and phone support is staffed 24/7 if a question comes up part way through the review.
This article is for educational and informational purposes only and does not constitute investment, tax, or legal advice, or a recommendation to buy or sell any security or sector. Sector and index figures cited reflect reported data as of the publication date and are subject to change. Past performance does not indicate future results. Investing involves risk, including the possible loss of principal. Firstrade Securities Inc. is a member of FINRA and SIPC.