Index Concentration Explained: What It Means When 10 Stocks Are 40% of the S&P 500

Index concentration has quietly reshaped what a '500-stock fund' actually delivers. Understanding the mechanic is what turns a headline into a usable insight.
Index concentration is the degree to which an index's performance depends on a small number of its members. In an index holding 500 companies, the intuitive assumption is that no single name matters much. That held reasonably well a decade ago. It holds far less well now.
According to S&P Dow Jones Indices figures reported by Reuters and Pensions & Investments, the 10 largest S&P 500 constituents now account for roughly 40% of the index's total weight, up from about 19% ten years earlier. The index still contains 500 companies; what has changed is how evenly those 500 names shape your outcome.
Market Cap Weighted Index, Explained in One Paragraph
Nearly every headline index — including the S&P 500 — weights holdings by market capitalization, so a company's share equals its market value as a proportion of the total. Nobody sets those weights by hand; they are an output, not an input. When a company's shares rise faster than the market, its weight rises automatically. The passive approach used by index funds generally results in lower costs and portfolio turnover, which can also improve tax efficiency. Market-cap weighting, meanwhile, is by construction momentum-following.
So concentration is not a flaw that crept into the methodology. It is the methodology working as intended during a period when a narrow group of companies has substantially outgrown the rest of the market.
S&P 500 Top 10 Weight: A Decade of Change
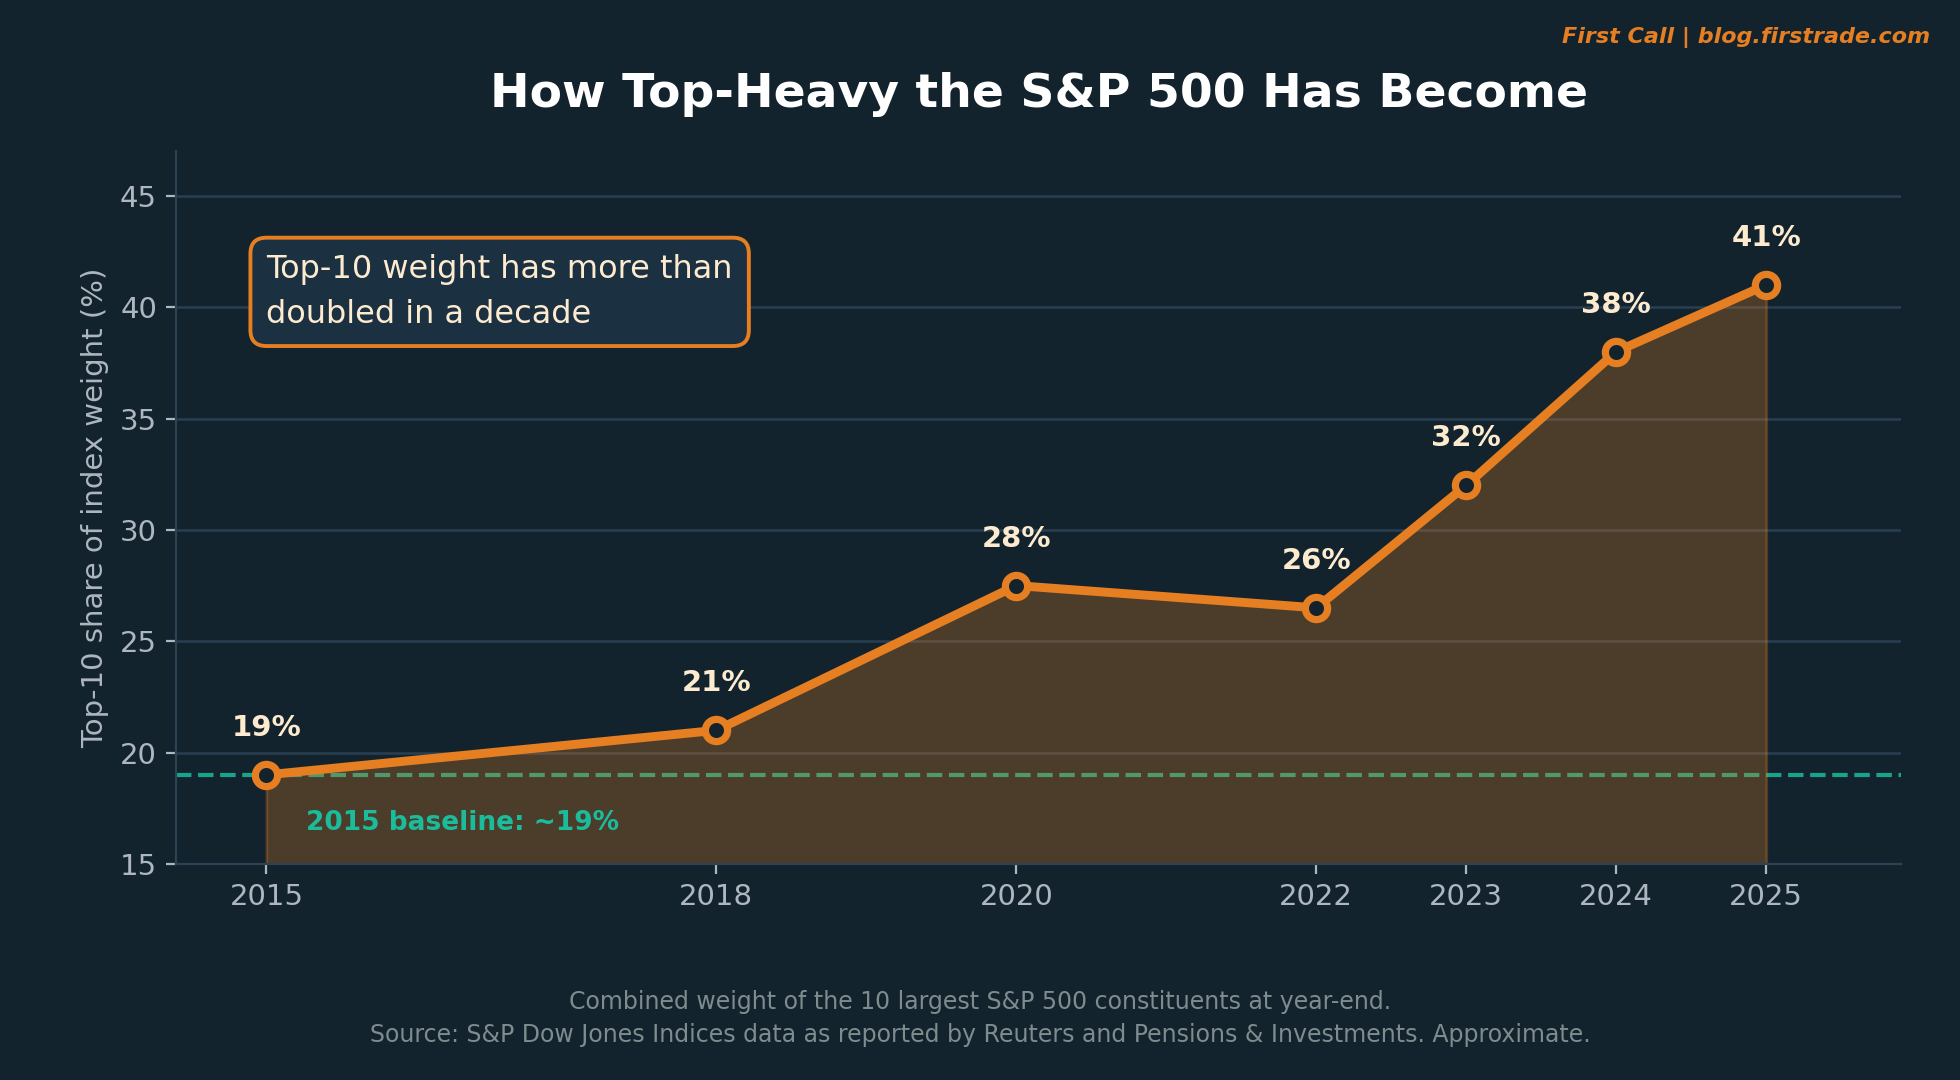
Figure 1: Combined weight of the 10 largest S&P 500 constituents at year-end, 2015 to 2025. Source: S&P Dow Jones Indices data as reported by Reuters and Pensions & Investments. Approximate.
Concentration rose gradually through the late 2010s, paused in 2022 when large technology shares fell harder than the broad market, then accelerated from 2023 onward. Providers publish slightly different figures depending on the measurement date — which is why every number here is approximate. The direction is consistent across sources.
One feature distinguishes this episode from earlier concentration peaks. Previously the largest members spanned unrelated industries — energy, pharmaceuticals, telecoms, banking — so a shock to one rarely moved the others. Today's largest constituents are linked by a shared theme in artificial intelligence. Correlated leadership means the top of the index tends to move together in both directions, reducing the diversification the holding count implies.
Is My Index Fund Diversified? Weight vs. Earnings
A more useful test than counting holdings compares how much of the index's market value the largest members represent against how much of its profit they generate.
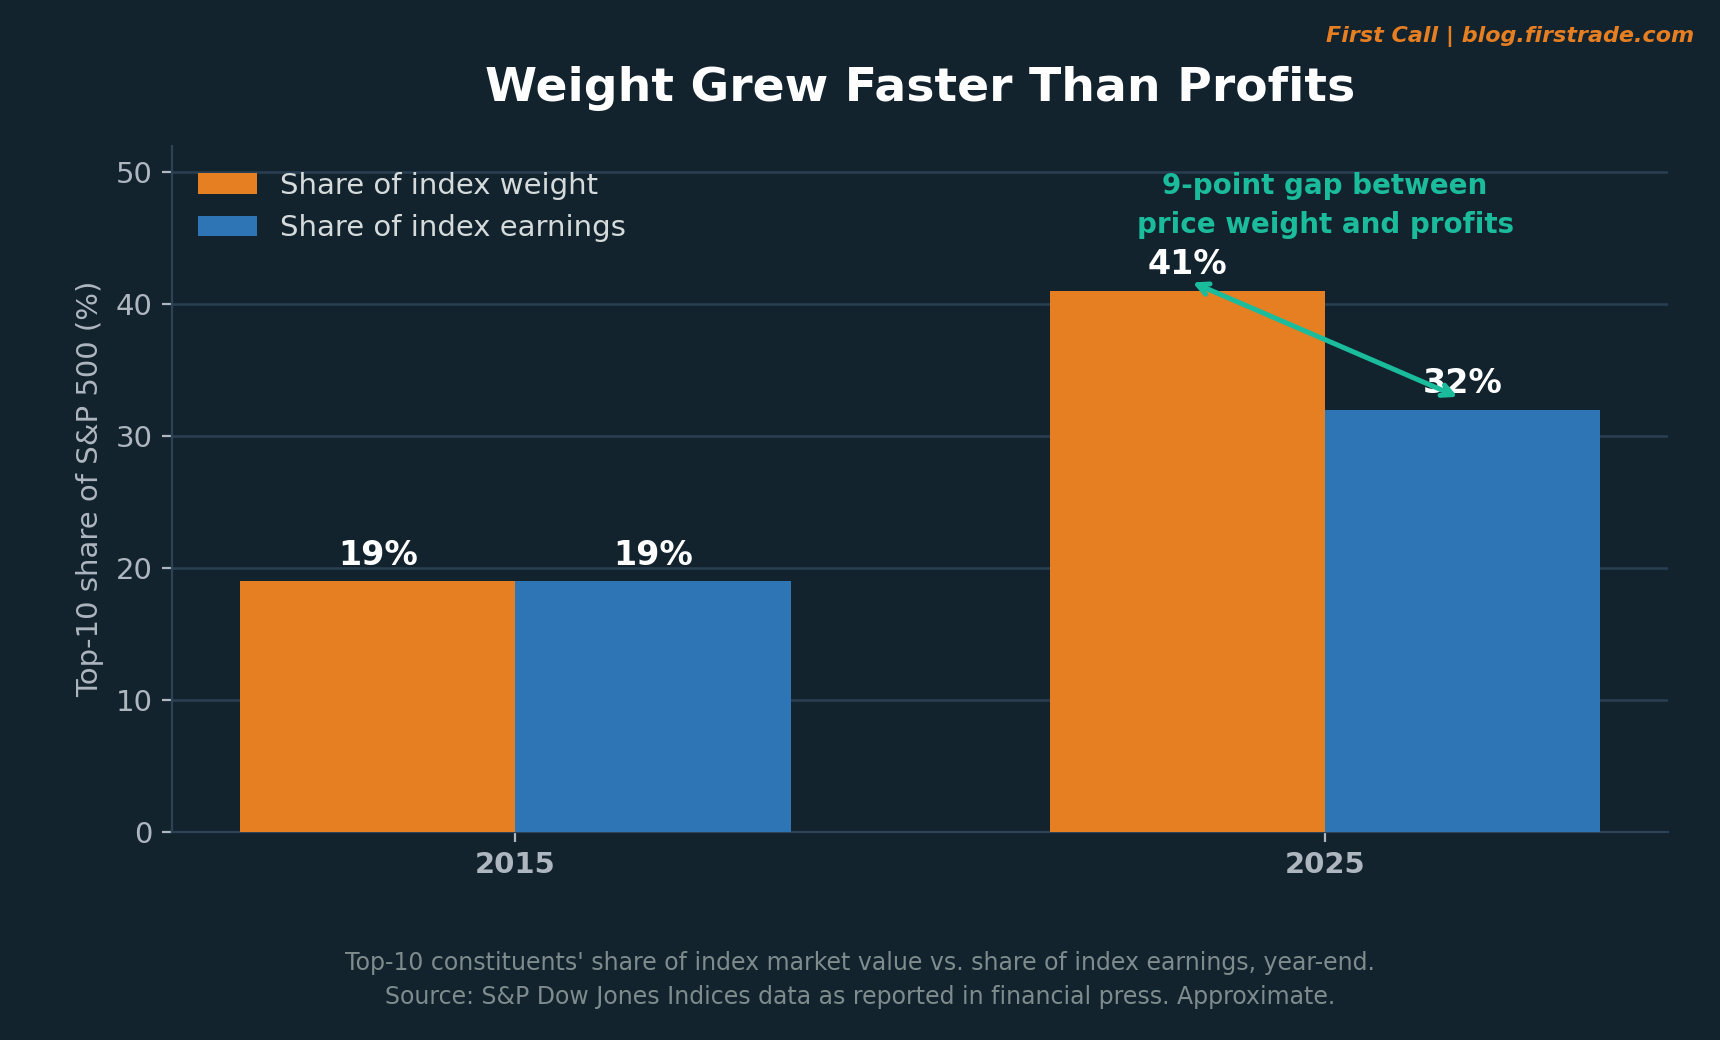
Figure 2: Top-10 constituents' share of S&P 500 market value vs. index earnings, year-end. Source: S&P Dow Jones Indices data as reported in financial media. Approximate.
In 2015 those two figures were closely aligned at roughly 19% each — market value and fundamentals moving together. By the end of 2025 the top 10 represented about 40% of index weight but around 32% of index earnings. That gap is not evidence of mispricing on its own; investors may reasonably pay more for faster-growing businesses. It does tell you something concrete: more of the index's value now rests on expected future profits rather than profits already reported, and expectations are the more volatile of the two.
Does index concentration mean I should sell my index fund?
That framing skips a step. Concentration is a characteristic to understand, not a signal to act on, and it has been elevated for several years while the index kept setting record highs — including through August 2026, as CNN Business and CNBC reported. Knowing your actual exposure is the more defensible response, so that whatever you decide, you decide it knowingly.
Equal Weight vs. Market Cap: Comparing the Alternatives
Several established methodologies address concentration differently. None is superior in all conditions, and each involves a genuine trade-off:
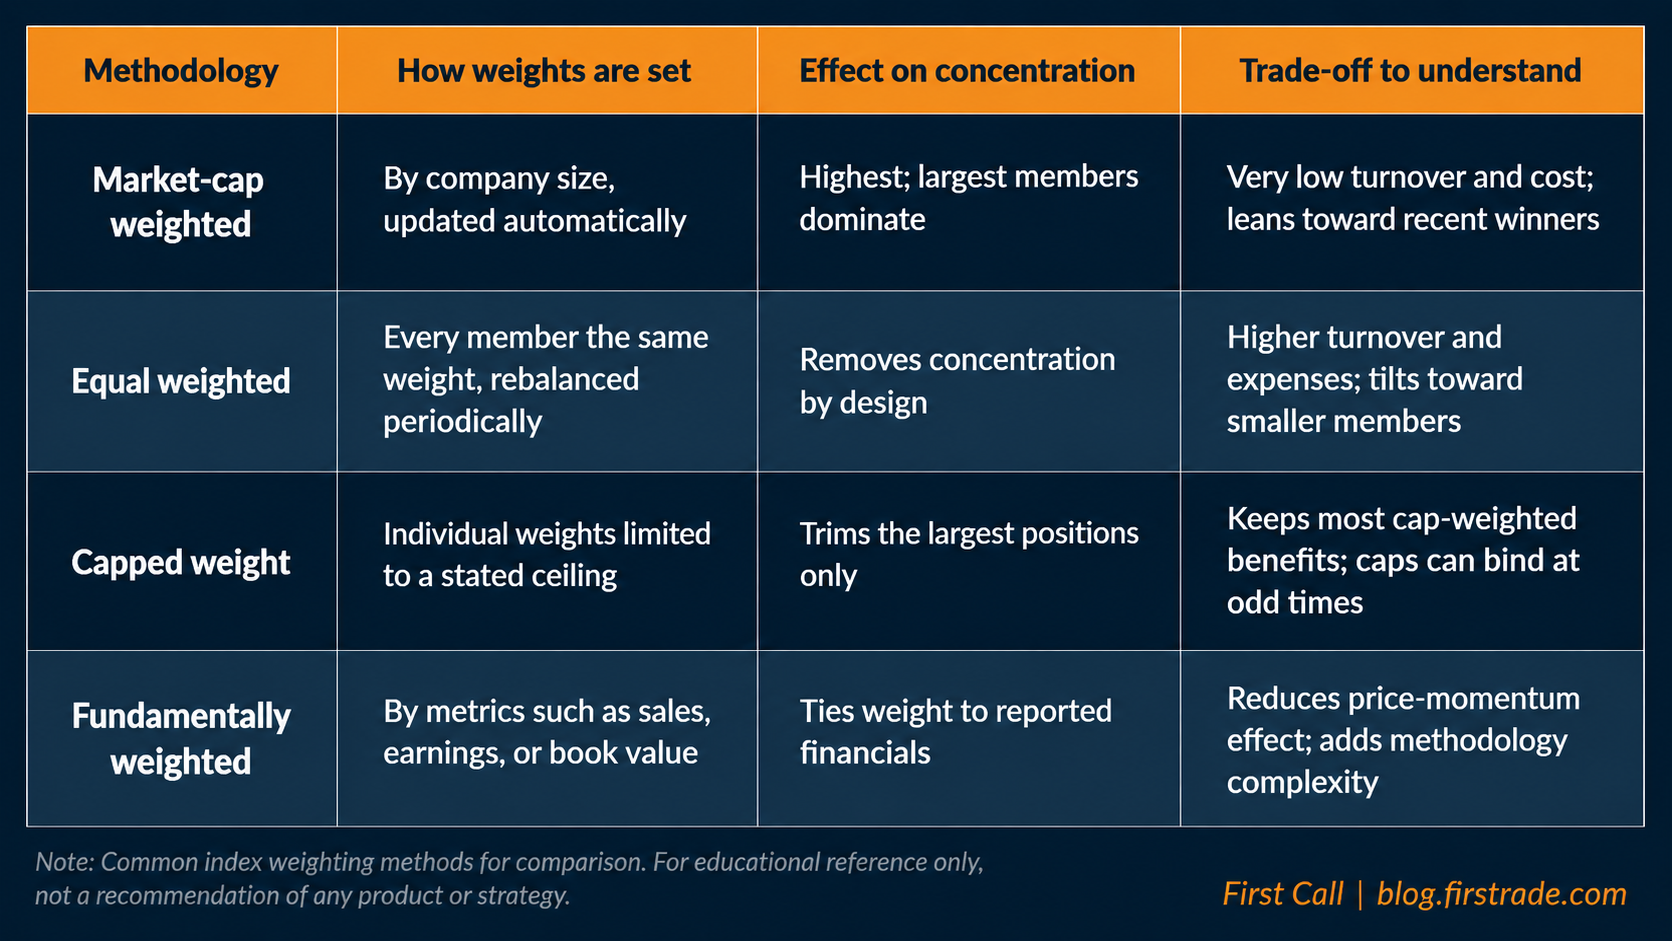
There is a fair counterargument worth stating plainly: cap weighting has delivered strong long-run results precisely because it lets winners run, and repeated academic work finds most attempts to improve on it underperform after costs. Concentration is often also largely self-correcting over long periods. Both points are well supported — and both argue for understanding your exposure, not necessarily changing it.
How do I check the overlap between my funds?
Fund overlap is where concentration most often goes unnoticed. Someone holding a broad market fund, a large-cap growth fund, and a technology sector fund may believe they hold three distinct positions while all three could lean on the same handful of companies. Every fund publishes its top-10 holdings in its fact sheet; listing those side by side usually reveals more than any single risk metric.
What to Consider With This Information
The practical value here is diagnostic. A few steps make concentration visible in your own portfolio:
Read the top-10 holdings percentage on each fund's fact sheet, then add up how much of your total portfolio those overlapping names represent.
Distinguish sector exposure from single-name exposure. A fund can look sector-diversified while a few companies still drive most of its movement.
Check whether other holdings compound the same exposure — company stock or a thematic fund often points the same direction as the index's largest members.
Broad international and fixed-income exposure are usually far less concentrated, which dilutes the effect without abandoning a core index position. Re-check annually — weights drift with prices, and a yearly review captures the change without inviting reactive trading.
None of this argues that a market-cap index fund is a poor core holding — it remains a low-cost, tax-efficient way to own the broad U.S. market. The point is narrower: the label 'diversified' now carries a footnote.
The Takeaway
A 500-company index in which 10 names carry roughly 40% of the weight is still a broad holding — but it is a different instrument from the one many investors picture on hearing the number 500. The 9-point gap between the top 10's share of index value and of index earnings is the detail worth remembering, because it shows how much of today's price rests on expectations.
Understanding what an index fund holds is step one; adjusting around it without friction is step two. Firstrade supports commission-free trading on U.S. stocks, ETFs, mutual funds, and options, with no options contract fees — which matters when an adjustment means several small positions rather than one large trade. And if a question surfaces while you are reading a fact sheet at midnight, Firstrade's 24/7 customer service is available.
Disclaimer: This article is for educational and informational purposes only and does not constitute investment, tax, or legal advice, nor a recommendation to buy or sell any security. Index weights and earnings‑share figures are approximate, are reported at different dates by different providers, and change continuously as prices move. Index composition is described for educational purposes only and no individual company is being evaluated or recommended. Diversification does not eliminate the risk of loss. Past performance does not guarantee future results. The market indexes referenced in this article are unmanaged statistical measures of market performance. Investors cannot invest directly in an index.
S&P 500 Index — A market‑capitalization‑weighted index that tracks approximately 500 of the largest publicly traded companies in the United States, representing about 80% of the total U.S. equity market value.
Firstrade Securities Inc. is a member of FINRA and SIPC. Securities products are not FDIC insured, are not bank guaranteed, and may lose value.