Stock Market Seasonality: What August and September Really Tell Investors

Stock market seasonality is one of the most repeated ideas in investing, and it gets loudest in late summer. Headlines warn that August drifts, that September is worse, and that investors should brace for turbulence before the autumn. The underlying data is real: decades of returns do show a recognizable rhythm across the calendar year. What the data does not show is a dependable trading signal. Knowing the difference between the two is what can separate useful context from an expensive superstition.
What the seasonality data actually shows
Two patterns hold up better than the rest. The first is the split between the two halves of the market year. Analysis of long-run S&P 500 returns finds that the November-through-April window has produced an average return of more than 7%, while the May-through-October window has averaged roughly 1.7%. The second is September's persistence as the weakest month: over the past 75 years the index has averaged about -0.7% in September, the poorest showing of any month, and that softness has survived enormous changes in market structure as shown in chart below.
August sits in the middle of that soft patch rather than at the bottom of it. Going back to 1950 it ranks as roughly the third-worst month of the year, and recent decades have not repaired its reputation: the S&P 500 has averaged a 0.1% gain in August over the past ten years and a 0.1% loss over the past twenty. Read carefully, that is not a warning about a crash. It describes a month that historically goes almost nowhere.
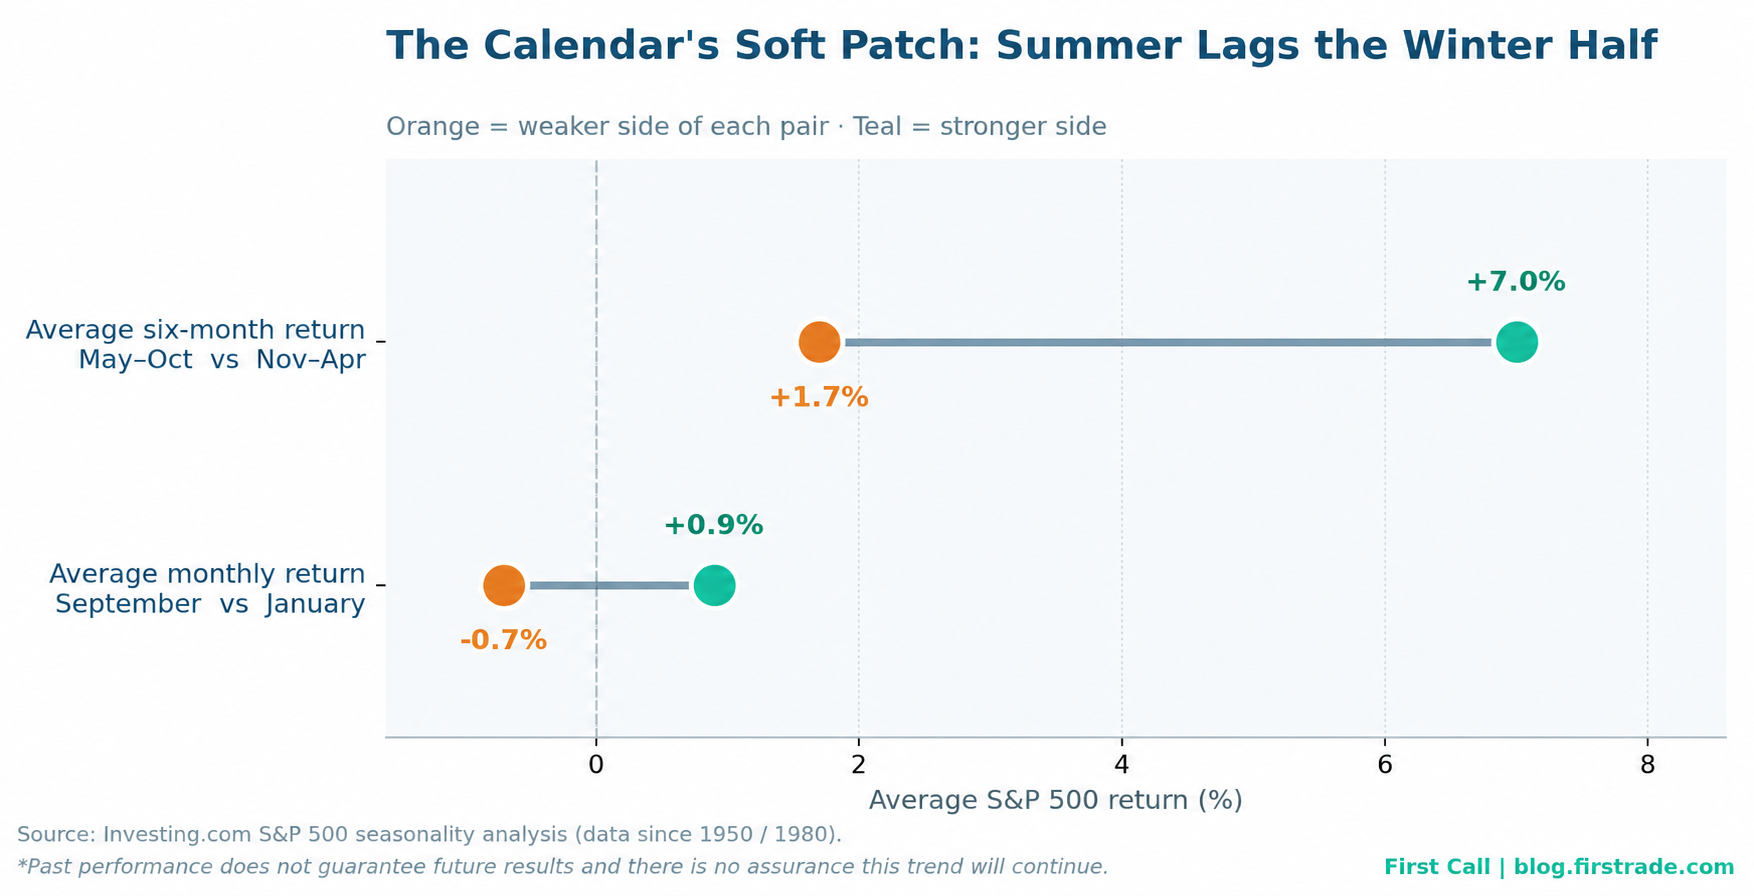
Chart 1: Average S&P 500 returns for the two halves of the calendar year, and for the weakest and one of the strongest individual months. Source: Investing.com seasonality analysis.
Is August really a bad month for stocks
Not bad so much as unproductive. An average close to zero means the historical record contains plenty of strong Augusts alongside plenty of weak ones - the positives and negatives largely cancel. When a month's average is near zero and the spread of outcomes around it is wide, the average tells you very little about what any single August will do. It is a statement about the middle of a distribution, not a forecast.
Why volatility tends to rise in late summer
The more durable seasonal effect may not involve returns at all. It involves volatility. Trading volumes thin out as institutional desks run short-staffed through August, and thinner markets amplify the price reaction to any single data release or headline. Early August 2026 illustrated the point: realized 30-day volatility stood at 20.2% for the Nasdaq Composite, noticeably above the 12.5% reading on the S&P 500 and 12.7% on the Dow Jones Industrial Average.
That spread is a useful reminder that 'the market' is not a single experience. A portfolio concentrated in high-growth technology names lives through a very different August than a broadly diversified one, even when headline index moves look mild. Seasonality discussions that focus only on the S&P 500 average quietly hide that difference.
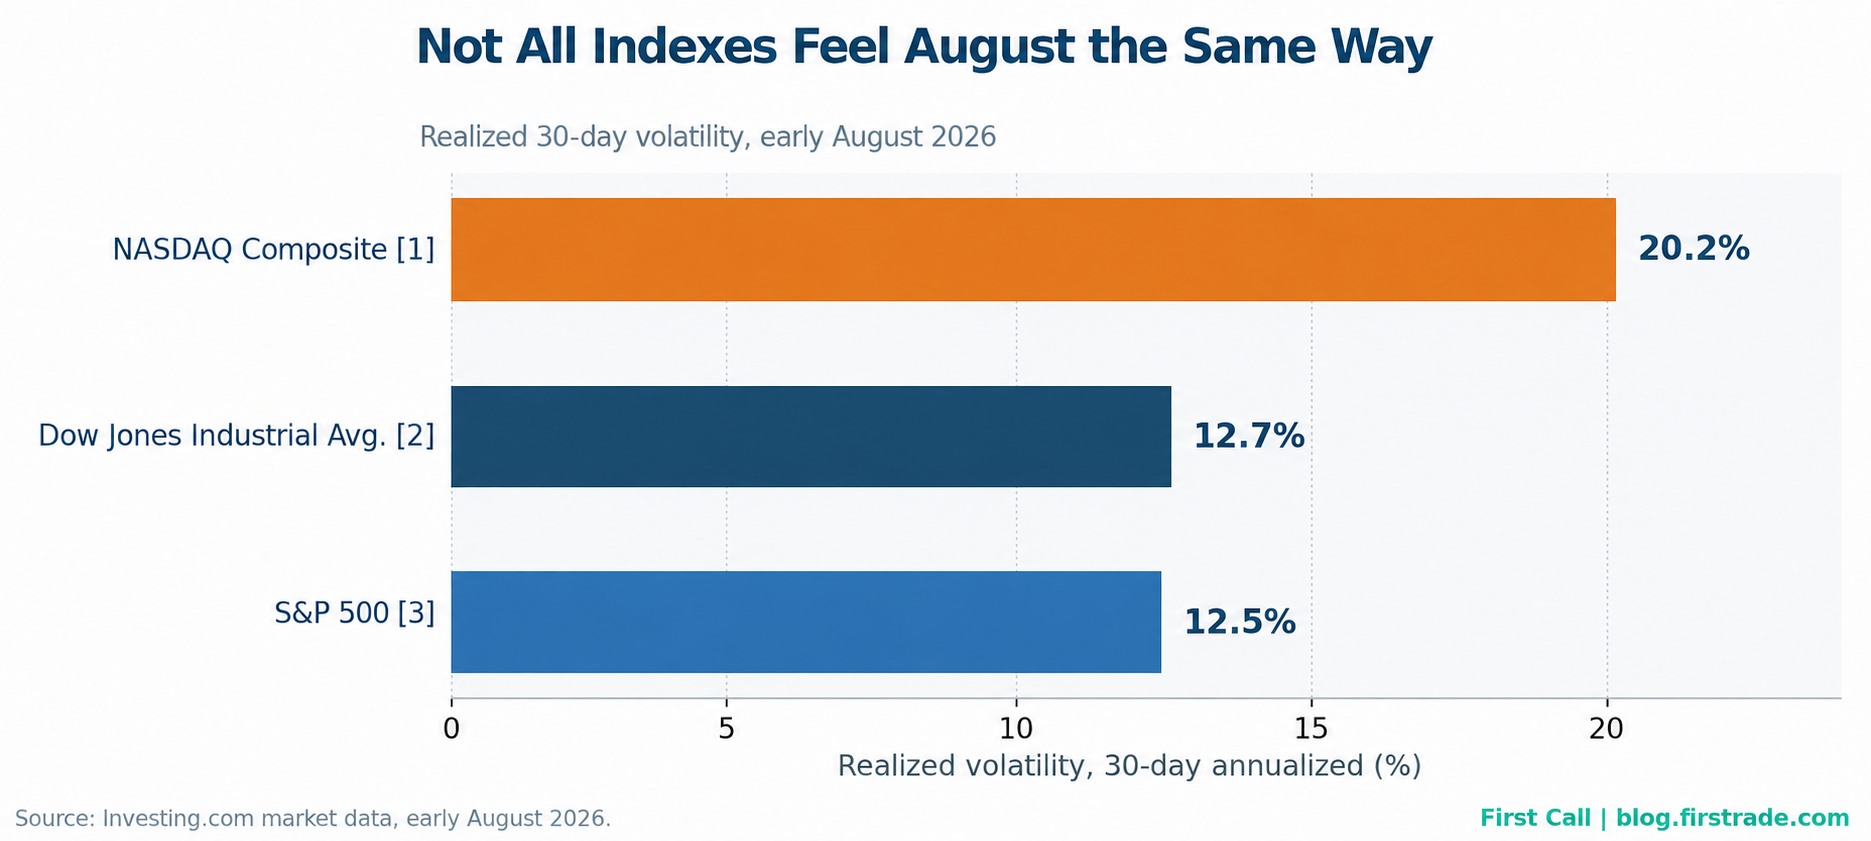
Chart 2: Realized 30-day annualized volatility by major U.S. index, early August 2026. Source: Investing.com market data.
Why seasonal patterns keep fading
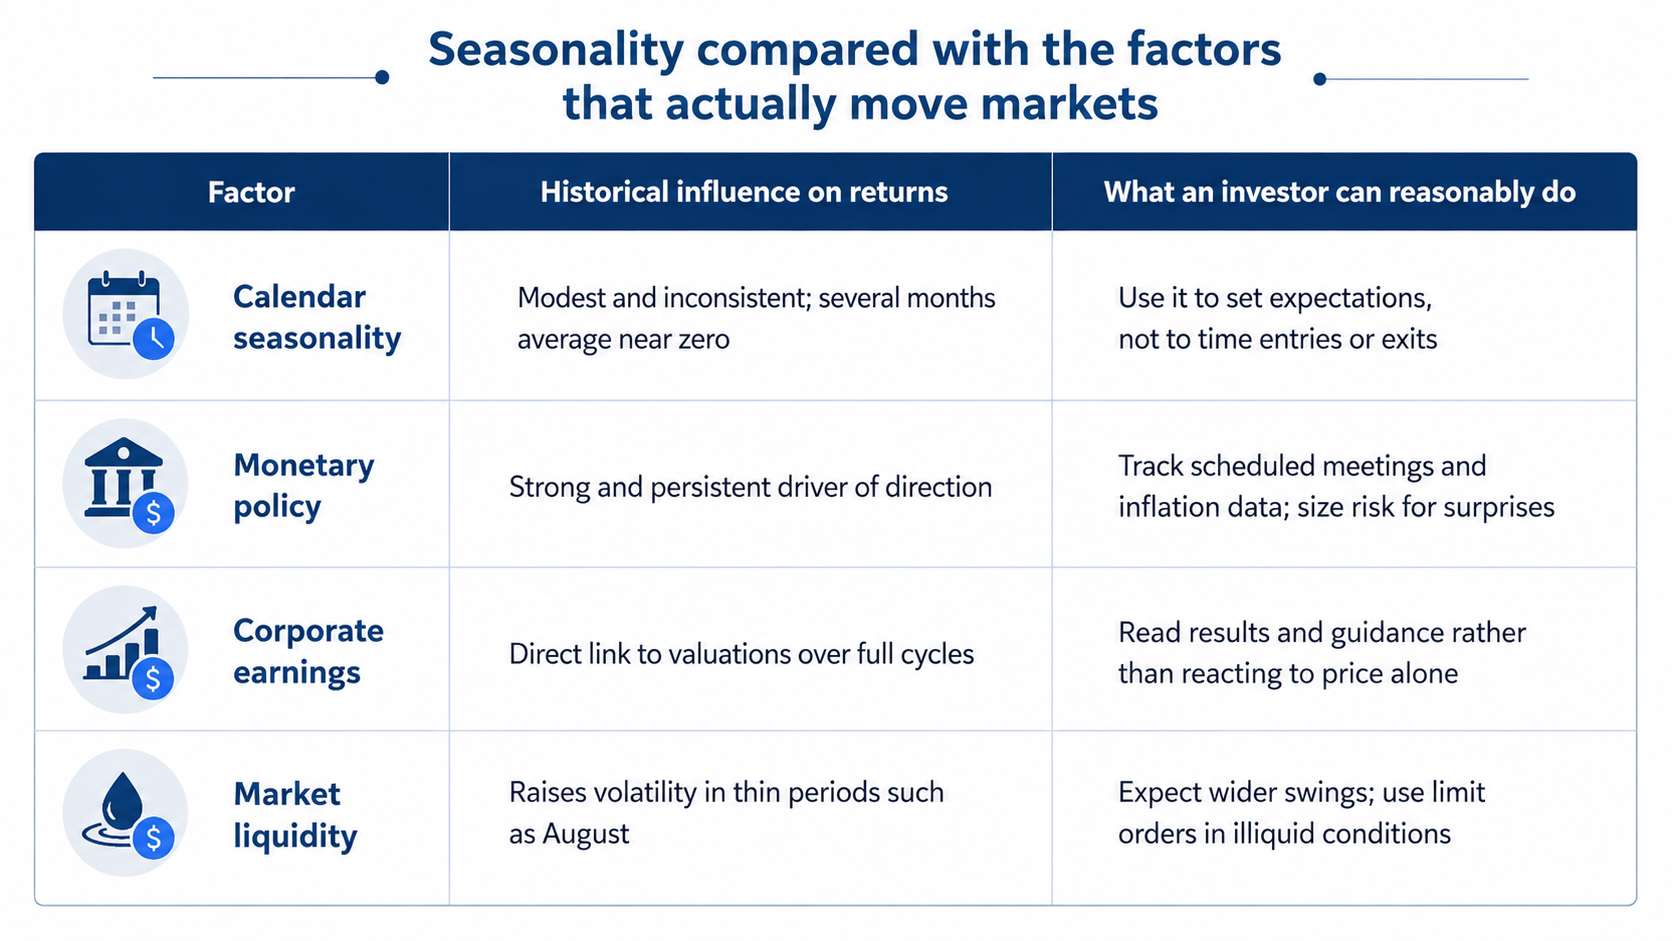
Calendar effects are weaker today than the textbooks suggest, and the reasons are structural. Algorithmic and quantitative strategies now account for a large share of market volume, and they arbitrage away simple, well-publicized calendar inefficiencies quickly. Cross-border capital flows have diluted the influence of any one country's tax and bonus cycles. Most of all, central bank policy and earnings have become far more powerful drivers of direction than the month on the calendar. The stretch after 2009 produced several strong summers that contradicted the seasonal script entirely.
The practical conclusion is that calendar patterns now behave as contextual tendencies rather than actionable signals. They can inform how much volatility to expect. They rarely justify a change in positioning on their own.
Frequently asked questions about seasonal investing
Does 'sell in May and go away' still work?
Partly, and less than it used to. The November-to-April half has beaten the May-to-October half on average over the long run, which is the kernel of truth in the adage. But the gap has narrowed, the summer half has still been positive on average, and an investor who exits every May incurs transaction costs, potential tax consequences, and the risk of missing the strong summers that periodically appear.
Should I wait until October to invest?
Waiting for a calendar date has a poor track record as a strategy. Averages are computed across many decades, and any single year can depart from them by a wide margin. Investors who contribute on a regular schedule - monthly or per paycheck - buy across strong and weak months automatically, which removes the need to guess which category the current month belongs to.
What is seasonality actually useful for?
Expectation management, mostly. Knowing that late summer has historically been quiet and choppy makes a flat, jumpy August less alarming and less likely to trigger a reactive decision. It is also a sensible time of year to schedule an unhurried portfolio review, precisely because there is usually less happening.
A calmer way to read the calendar
The most useful interpretation of seasonality is psychological rather than tactical. History suggests that the weeks ahead may deliver small moves and larger-than-usual swings around them, and that the strongest stretch of the year has typically arrived later. That framing helps an investor sit still when sitting still is the right call, and it makes the case for a plan that does not depend on correctly guessing which month behaves like its average.
Seasonal patterns come and go, but the drag from costs and the damage from reactive decisions are permanent. That is where a platform choice quietly matters. Firstrade offers commission-free trading on U.S. stocks, ETFs, mutual funds, and options, with no options contract fees, so a quiet August does not turn into an expensive one. And when a seasonal headline raises a question at an odd hour, 24/7 customer service is available to answer it.
Disclosure: This article is for educational and informational purposes only. It is not investment advice and is not a recommendation to buy or sell any security. Investing involves risk, including the possible loss of principal. Historical patterns and past performance do not guarantee future results. The market indexes referenced in this article are unmanaged statistical measures of market performance. Investors cannot invest directly in an index.
[1] NASDAQ Composite — Tracks all 3,000+ stocks listed on the Nasdaq exchange and is heavily weighted toward technology and growth-oriented companies.
[2] Dow Jones Industrial Average (DJIA) — A price‑weighted index of 30 large, established U.S. companies (“blue chips”). It is the oldest and most quoted U.S. stock index.
[3] S&P 500 — A market‑capitalization‑weighted index tracking approximately 500 of the largest U.S. companies, representing about 80% of total U.S. equity market value.
Firstrade Securities Inc. – Member FINRA/SIPC.