
The Q2 2026 earnings season is shaping up to be one of the strongest in years. With roughly 10% of S&P 500 companies having reported results as of mid-July, the blended year-over-year earnings growth rate stands at 24.7%, according to FactSet Earnings Insight — up from 22.5% a week earlier and 23.2% at the close of the quarter. For retail investors, headlines about record profit growth can be exciting, but the more useful question is what this data actually tells you about the market you're invested in, and how to use it without overreacting.
S&P 500 Earnings Growth Hits a Multi-Year High
If the current blended estimate holds, Q2 2026 will mark the second consecutive quarter of earnings growth above 20% and the seventh straight quarter of double-digit profit growth for the index. Revenue growth is running just as hot: the blended revenue growth rate is 12.8%, which would be the highest since Q2 2022 and the second straight quarter of double-digit revenue growth. Growth isn't expected to fade quickly either — analysts currently project 27.0% earnings growth for Q3 2026 and 24.6% for Q4 2026, putting full-year 2026 growth at an estimated 24.5%.
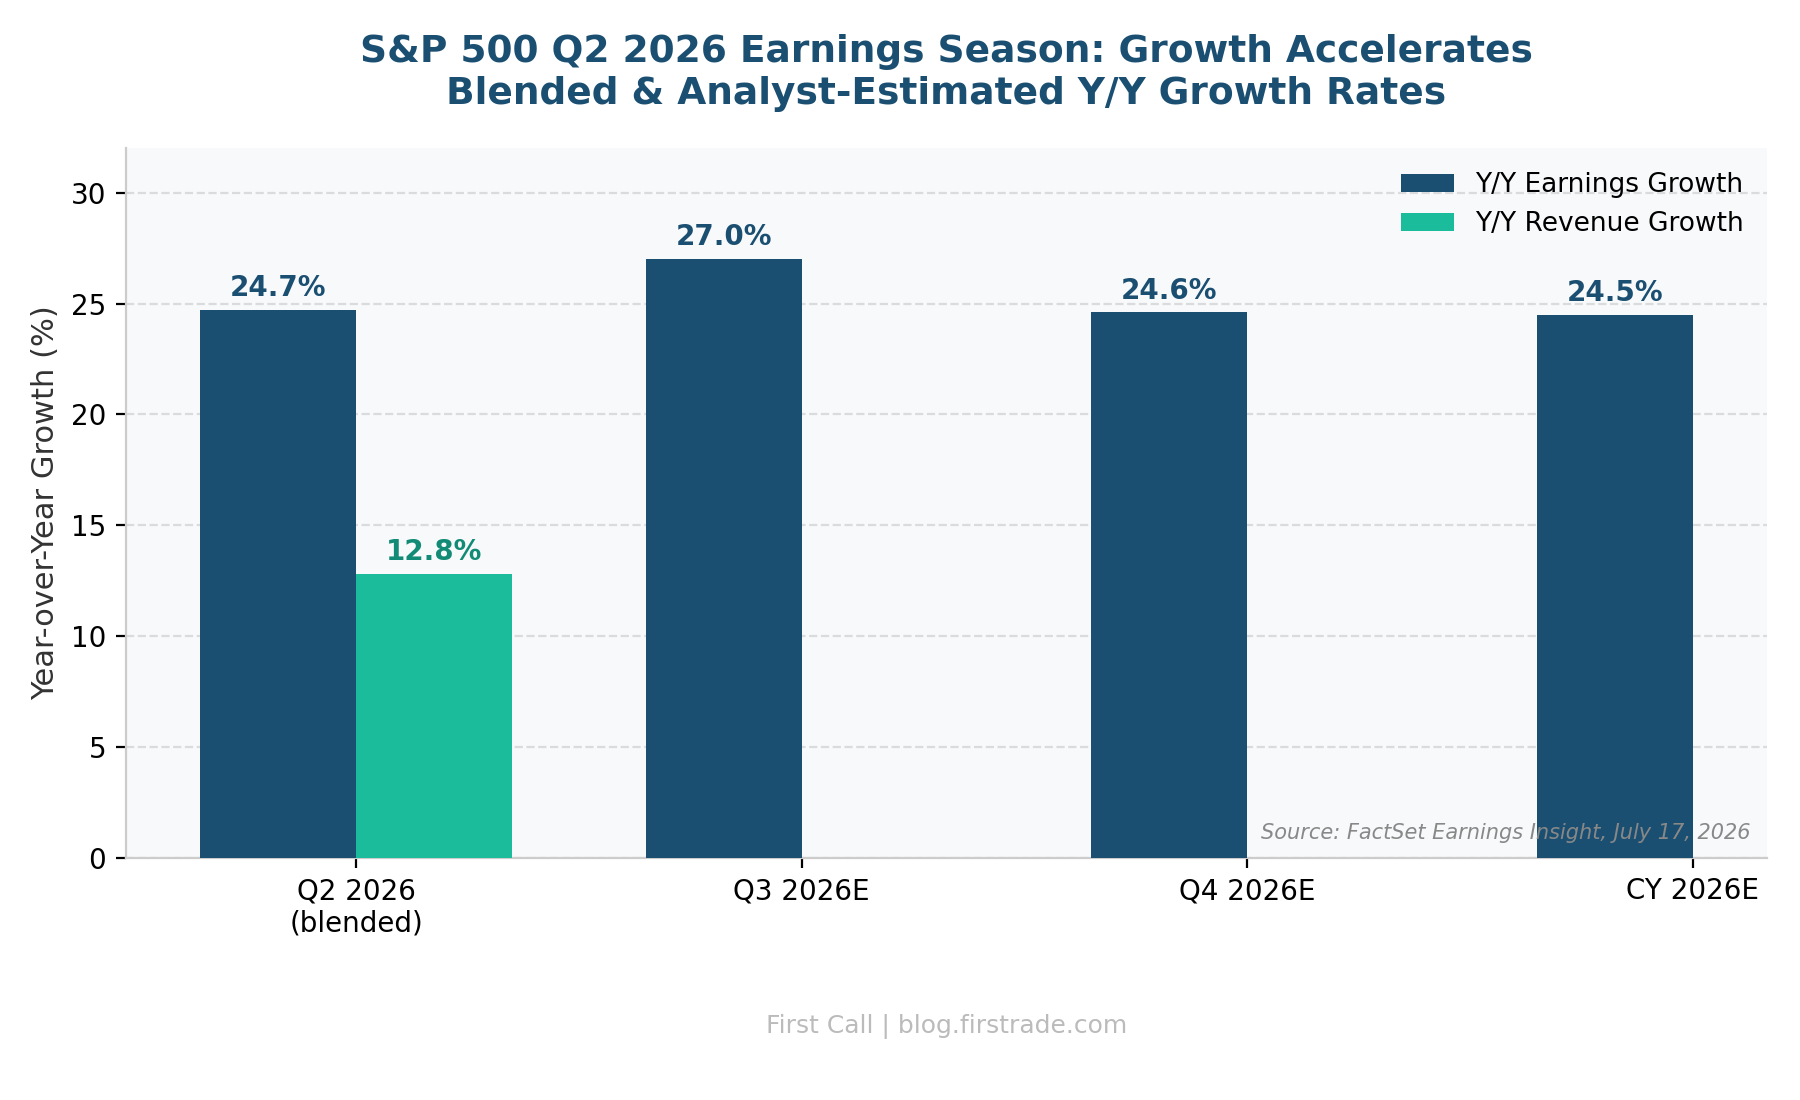
S&P 500 blended and analyst-estimated year-over-year growth rates. Source: FactSet Earnings Insight, July 17, 2026. Forecasted earnings are estimates and not guaranteed.
Why Are So Many Companies Beating Estimates?
Beat rates — the share of companies reporting results above analyst forecasts — are running well ahead of historical norms this quarter. Roughly 88% of companies that have reported so far posted EPS above estimates, compared with a 5-year average of 78% and a 10-year average of 76%. On the revenue side, 85% of reporters have beaten estimates, versus 5-year and 10-year averages of 70% and 68%, respectively. In aggregate, companies are reporting earnings 16.4% above estimates, more than double the typical 7.0% five-year average surprise.
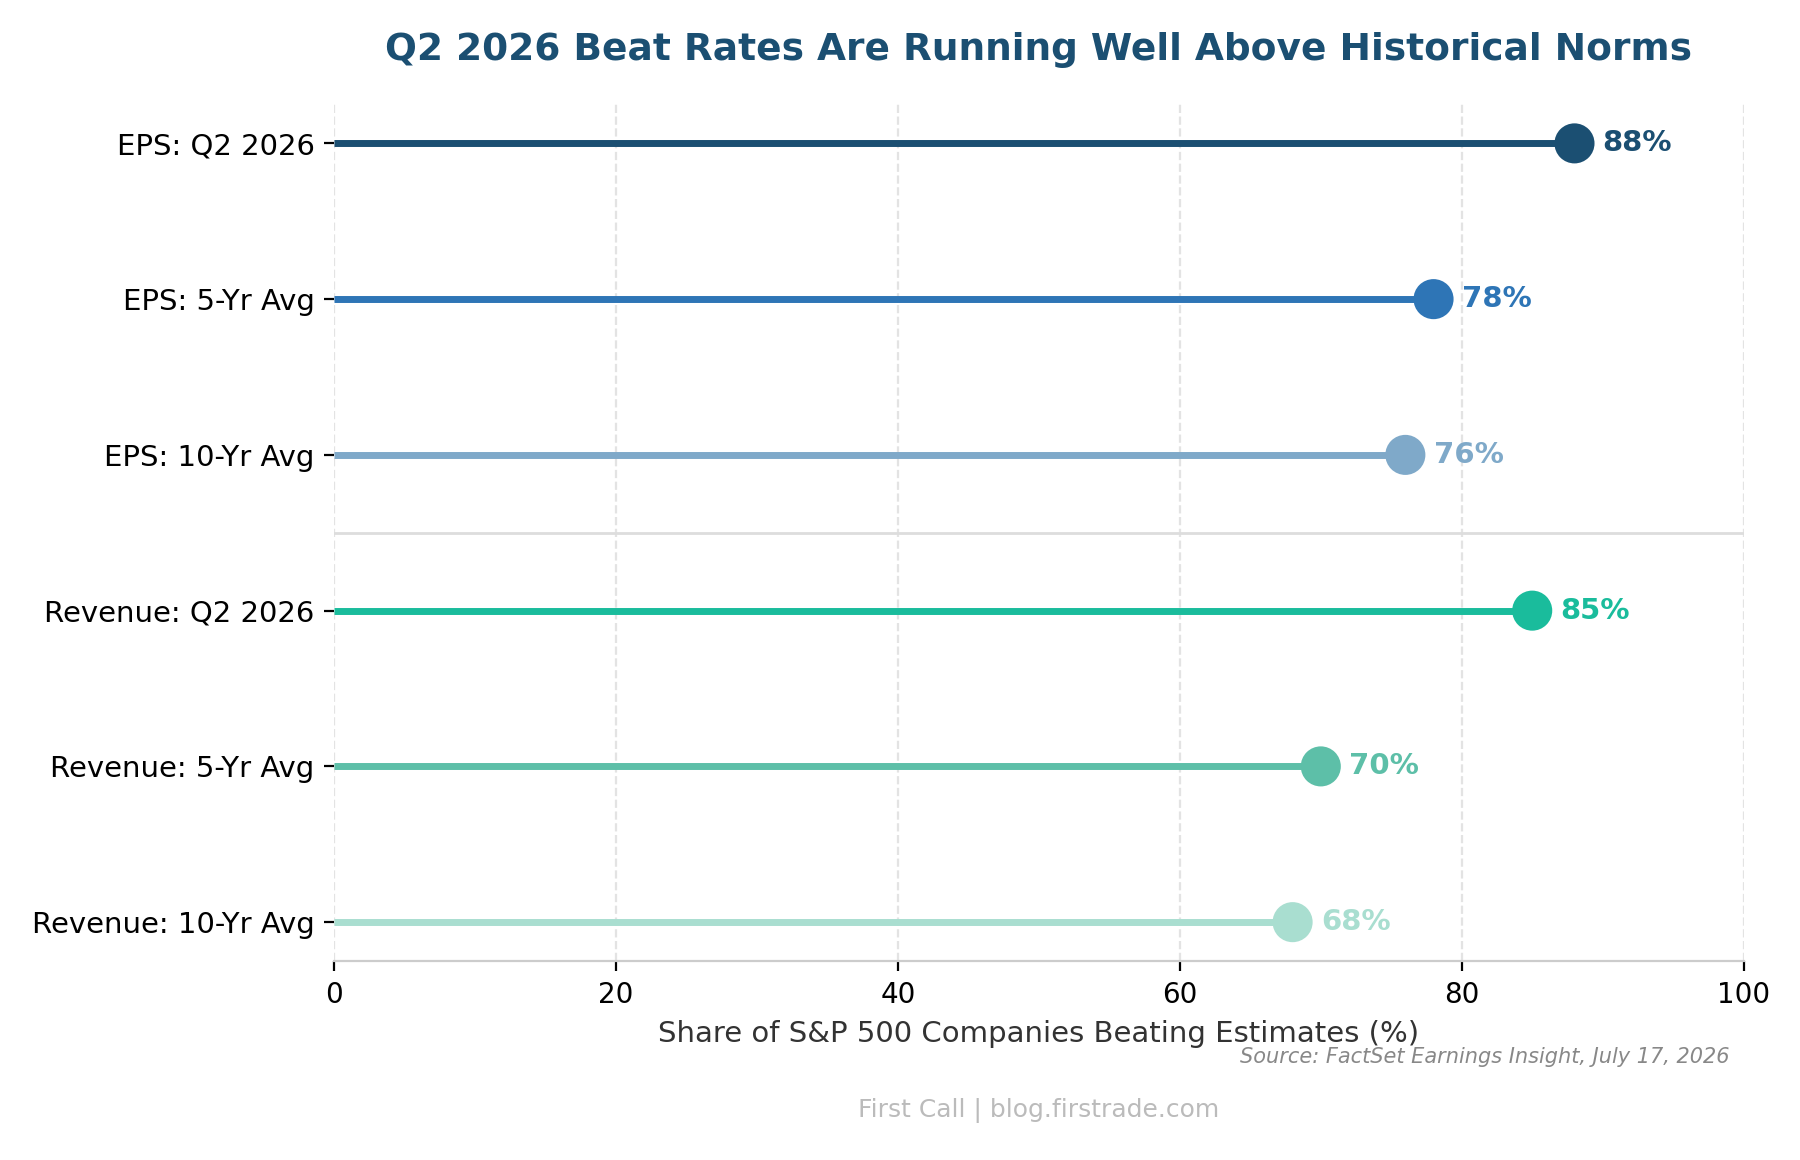
Share of S&P 500 companies beating EPS and revenue estimates, Q2 2026 vs. historical averages. Source: FactSet Earnings Insight, July 17, 2026.
Sector performance has been uneven, though. Ten of the eleven S&P 500 sectors are reporting or projected to report year-over-year earnings growth, led by Energy, Information Technology, and Materials — all posting double-digit gains. Health Care stands out as the only sector expected to post a year-over-year earnings decline, a reminder that a strong index-level number can mask real dispersion underneath.
What a Hot Earnings Season Means for Your Portfolio
Does a strong earnings season guarantee stock gains?
Not on its own. Earnings growth is one input among several that drive stock prices, alongside valuation, interest rates, and broader macroeconomic conditions. Notably, the market's forward 12-month P/E ratio currently sits at 20.3 — above both the 5-year average (19.9) and the 10-year average (19.0), according to FactSet Earnings Insight (July 17, 2026). That means investors are already paying a premium for this growth, which can make stocks more sensitive to any disappointment in guidance or slowing momentum in future quarters.
What should retail investors watch for the rest of 2026?
Beyond the headline growth number, it's worth tracking whether beat rates hold up as more (and typically smaller) companies report, whether sector leadership broadens beyond Energy, Technology, and Materials, and whether forward guidance from management teams supports the 27.0% and 24.6% growth estimates already baked in for Q3 and Q4. A deceleration in any of these areas — even from a high base — can matter more to markets than the absolute growth figure.
How should I think about sector concentration risk this quarter?
The sectors leading this quarter's growth — Energy, Information Technology, and Materials — are also sectors that can be more sensitive to swings in commodity prices, capital spending cycles, and AI-related capital expenditure trends. A portfolio that has drifted toward overweighting these areas simply because they've performed well may carry more concentration risk than an investor originally intended. Reviewing sector weightings periodically, rather than only when a decline forces the issue, is one of the simplest ways retail investors can keep concentration risk aligned with their own risk tolerance rather than with whichever theme happens to be leading the market that quarter.
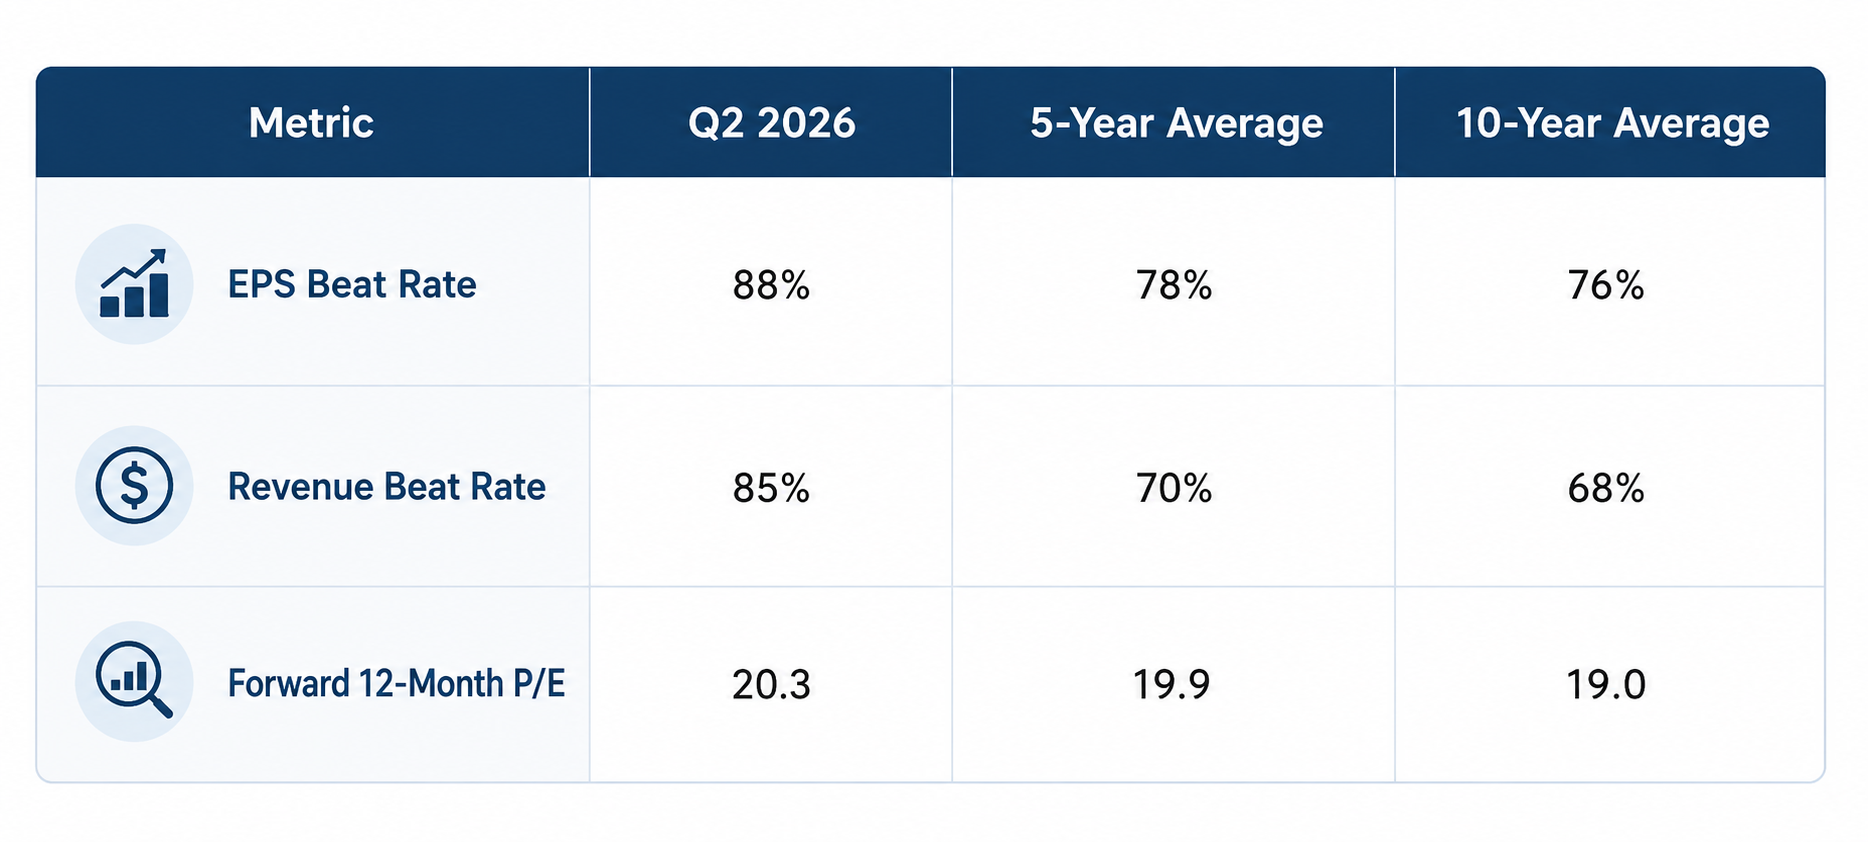
Source: FactSet Earnings Insight, July 17, 2026.
Turning Earnings Data Into a Long-Term Strategy
For a self-directed investor, earnings season is best treated as an information update rather than a trading signal. Rather than chasing whichever stock posted the biggest single-day pop after a beat, it can be more productive to use the quarter's results to check whether your existing sector exposure still matches your goals — for example, whether you're overweight a sector like Health Care that's lagging, or concentrated in a narrow group of large-cap names that happen to be driving the index-level growth number. Reviewing earnings data alongside a diversified, long-term plan — rather than in isolation — is generally more useful than reacting to any single report.
Firstrade makes it easier to put these ideas into practice: commission-free trading on U.S. stocks, ETFs, mutual funds, and options, no options contract fees, and 24/7 customer service whenever questions come up during earnings season.
Firstrade Securities Inc. is a member of FINRA and SIPC. This article is provided for general educational and informational purposes only and does not constitute investment, tax, or legal advice, nor a recommendation to buy or sell any security. Investing involves risk, including the possible loss of principal. Past performance is not indicative of future results. Please consult a qualified professional before making investment decisions. S&P 500 is a stock market index tracking the performance of 500 US large cap companies. You cannot invest directly in an index.